Current trend
Since the end of last month, the XPT/USD pair has been actively losing value, being pressured by reports about a possible postponement of the change in the course of monetary policy in the United States: back in December, investors predicted the beginning of a decrease in costs borrowing in March, but now they expect changes no earlier than June, which strengthens the position of the American currency against its main competitors, including metals.
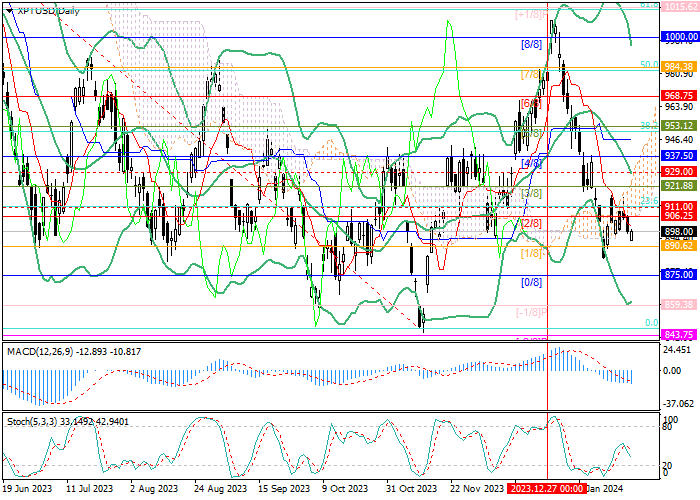
Currently, the price is consolidated below the 23.6% Fibonacci retracement level (911.00), which allows quotes to further decrease to the targets of 875.00 (Murrey level [0/8]) and 859.38 (Murrey level [-1/8]). The key support zone for the "bulls" is 929.00–937.50 (the central line of Bollinger Bands, Murrey level [4/8]); when the trading instrument consolidates above it, there will be prerequisites for changing the current downtrend and resuming the growth to 968.75 (Murrey level [6/8]) and 984.38 (Murrey level [7/8], 50.0% Fibonacci retracement), but so far this scenario seems less likely.
Technical indicators indicate the continuation of the decline: Bollinger Bands and Stochastic are pointing downwards, MACD is stable in the negative zone.
Support and resistance
Resistance levels: 937.50, 968.75, 984.38.
Support levels: 875.00, 859.38.
Trading tips
Short positions can be opened from the 892.00 mark with targets of 875.00, 859.38 and stop-loss around 903.40. Implementation period: 5–7 days.
Long positions can be opened above the level of 937.50 with targets of 968.75, 984.38 and stop-loss around 915.00.


Hot
No comment on record. Start new comment.