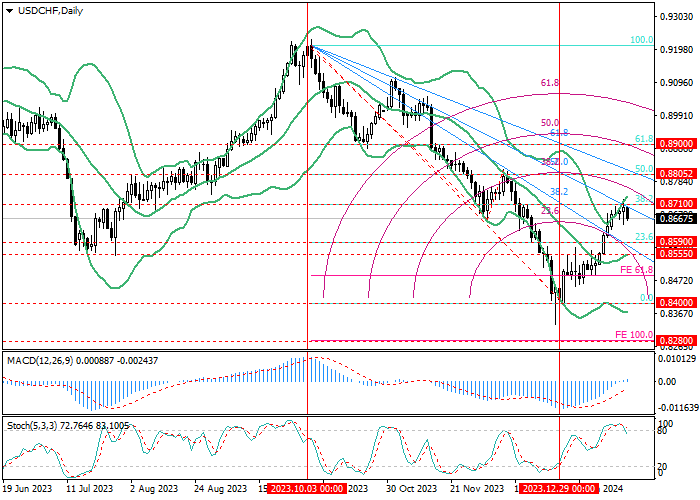
USD/CHF, D1
On the D1 chart, the USD/CHF pair has been rising since the beginning of the month: the price reversed around 0.8400 (0.0% retracement) and has now reached the level of 0.8710 (38.2% retracement), supported by a descending fan line of 50.0%, after which it will be able to continue moving with targets at 0.8805 (50.0% retracement), 0.8900 (61.8% retracement). The key support zone for the "bears" is 0.8590–0.8555 (23.6% retracement, the central line of Bollinger Bands), at the breakdown of which the downward dynamics will resume to the levels of 0.8400 (0.0% retracement) and 0.8280 (100.0% expansion).
Technical indicators do not give a clear signal: Bollinger Bands are reversing up, and MACD has moved into a positive zone, signalling an attempt to change the downtrend, but Stochastic is leaving the overbought zone, which does not exclude a resumption of a decline.

USD/CHF, W1
On the W1 chart, the price continues to grow, reversing around 0.8400 (0.0% retracement) and is now close to the level of 0.8795 (23.6% retracement, the central line of Bollinger Bands), consolidation above which will open the possibility for continued upward dynamics to the 0.9035 mark (38.2% retracement). Otherwise, the quotes may return to the initial growth point of 0.8400.
Technical indicators do not give a clear signal: Bollinger Bands are pointing down, but MACD is decreasing in the negative zone, and Stochastic is directed up.

Support and resistance
In the near future, the continuation of price growth seems more likely. If the level of 0.8710 is broken out (38.2% retracement, D1), its targets may be 0.8805 (50.0% accumulation of retracements , D1 and 23.6%, W1), 0.8900 (61.8% retracement, D1) and 0.9035 (38.2% retracement, W1). After the breakdown of the level of 0.8555 (the central line of Bollinger Bands, D1), the decline may resume to the targets of 0.8400 (0.0% retracement, D1 and W1) and 0.8280 (100.0% expansion, D1).
Resistance levels: 0.8710, 0.8805, 0.8900, 0.9035.
Support levels: 0.8555, 0.8400, 0.8280.
Trading tips
Long positions can be opened above 0.8710 with targets at 0.8805, 0.8900, 0.9035 and stop-loss around 0.8650. Implementation period: 5–7 days.
Short positions can be opened below the 0.8555 mark with targets at 0.8400, 0.8280 and stop-loss around 0.8620.


Hot
No comment on record. Start new comment.