Current trend
The XAU/USD pair is correcting sideways, trading at 2024.0 in response to very low investor demand for exchange-traded funds (ETFs) backed by gold.
Thus, since the beginning of the year, the volumes of the largest gold fund SPDR Gold Shares (GLD) have decreased by 2.2% compared to December, and the overall level of cash reserves in such organizations have been at lows since 2020 amid high interest rates, providing better returns from investing in bonds. It could only change once the US Federal Reserve plans to cut interest rates become clearer but for now, according to the Chicago Mercantile Exchange (CME) FedWatch Instrument, there is a 97.4% chance that borrowing costs will hold, keeping current yields on the leading 10-year bonds higher 3.0%. Investors' demand on commodity exchanges has stabilized slightly below early January: according to CME data, the average daily trading volume is 224.0K positions compared to 414.0K transactions previously.
Thus, the main fundamental factors confirm the continuation of the current sideway trend with a slight downward shift against a local strengthening of the American dollar, which exceeded 103.000 in USDX.
Support and resistance
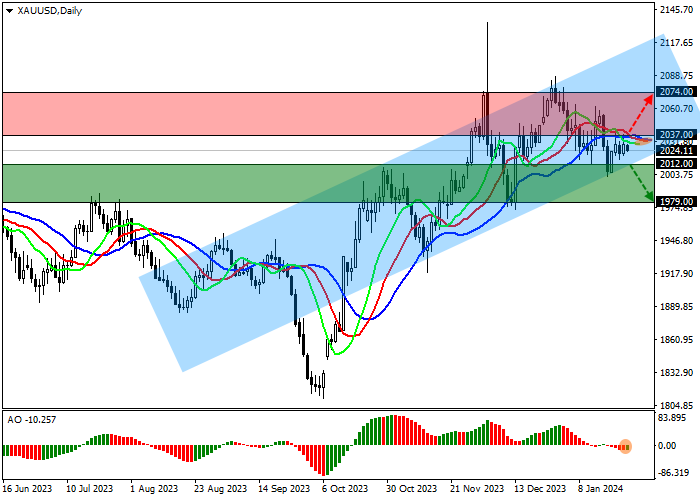
On the daily chart, the trading instrument is correcting, approaching the support line of the local ascending channel with dynamic boundaries of 2088.0–2010.0.
Technical indicators keep an unstable downward signal: fast EMA on the Alligator indicator are below the signal line, expanding the range of fluctuations, and the AO histogram forms corrective bars close to the transition level.
Resistance levels: 2037.0, 2074.0.
Support levels: 2012.0, 1979.0.
Trading tips
Short positions may be opened after the price declines and consolidates below 2012.0 with the target at 1979.0. Stop loss – 2020.0. Implementation period: 7 days or more.
Long positions may be opened after the price rises and consolidates above 2037.0 with the target at 2074.0. Stop loss – 2030.0.


Hot
No comment on record. Start new comment.