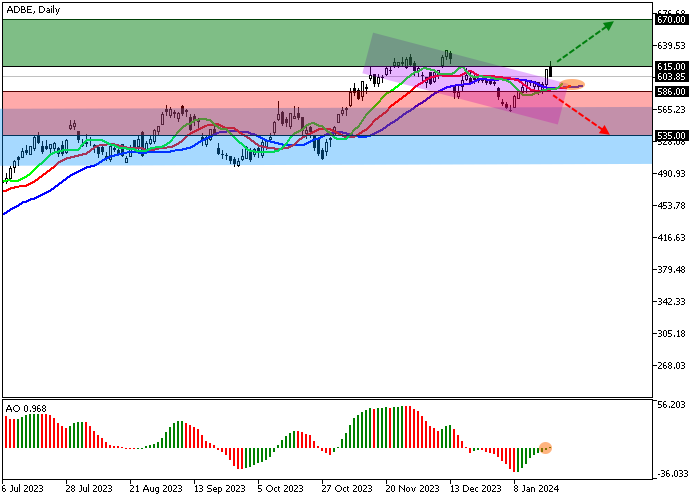
Shares of Adobe Inc., a leading American software developer, are moving in a corrective trend at 604.00.
On the daily chart, the price is rising and left a sideways corridor of 567.00–500.00 yesterday.
On the four-hour chart, after back-testing the channel resistance level of 568.00, the quotes reversed and are forming a new growth wave, which will soon overcome the local trend high of 633.00, after which it may reach 670.00.
Technical indicators gave a buy signal: the EMA fluctuation range on the Alligator indicator is expanding upward, and the AO histogram is forming ascending bars in the buy zone.
Trading tips
Long positions may be opened after the price rises and consolidates above 615.00 with the target at 670.00. Stop loss – 600.00. Implementation period: 7 days or more.
Short positions may be opened after the price declines and consolidates below 586.00 with the target at 535.00. Stop loss – 595.00.
Disclaimer: The content above represents only the views of the author or guest. It does not represent any views or positions of FOLLOWME and does not mean that FOLLOWME agrees with its statement or description, nor does it constitute any investment advice. For all actions taken by visitors based on information provided by the FOLLOWME community, the community does not assume any form of liability unless otherwise expressly promised in writing.


Hot
No comment on record. Start new comment.