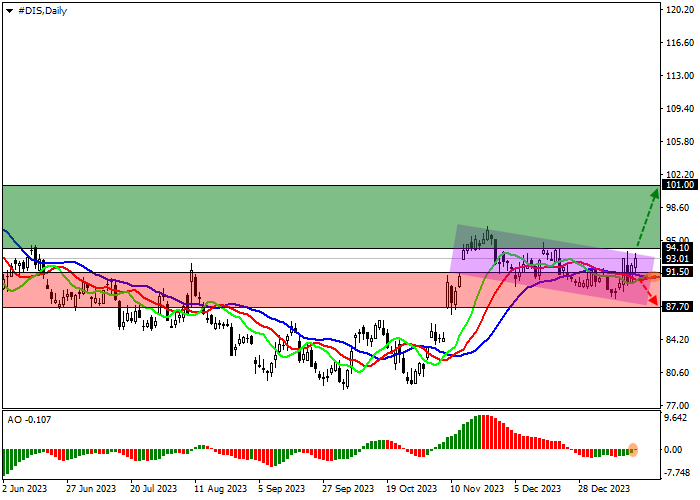
Saham The Walt Disney Co., salah satu pemimpin industri hiburan global, ditradingkan dalam tren korektif di 93.00.
Pada grafik harian, harga naik, meninggalkan channel turun global dengan batas dinamis 85.00–77.00.
Pada grafik empat jam, harga secara bertahap menurun dalam Flag trend continuation pattern, mencapai garis resistance di 93.00. Implementasi formasi di 94.00 dapat terjadi kapan saja, setelah itu pertumbuhan ke level tertinggi akhir musim panas di 100.00 akan dimulai.
Indikator teknis memperkuat sinyal beli: fast EMA pada indikator Alligator bergerak menjauh dari garis sinyal, dan histogram AO membentuk batang korektif, naik di zona beli.
Tips perdagangan
Posisi buy dapat dibuka setelah harga naik dan berkonsolidasi di atas 94.10 dengan target di 101.00. Stop loss – 91.00. Periode implementasi: 7 hari atau lebih.
Posisi sell dapat dibuka setelah harga turun dan berkonsolidasi di bawah 91.50 dengan target di 87.70. Stop loss – 93.00.
Disclaimer: The content above represents only the views of the author or guest. It does not represent any views or positions of FOLLOWME and does not mean that FOLLOWME agrees with its statement or description, nor does it constitute any investment advice. For all actions taken by visitors based on information provided by the FOLLOWME community, the community does not assume any form of liability unless otherwise expressly promised in writing.


Hot
No comment on record. Start new comment.