Saham PayPal Holdings Inc., sistem pembayaran debit Amerika, terkoreksi di level 58.00.
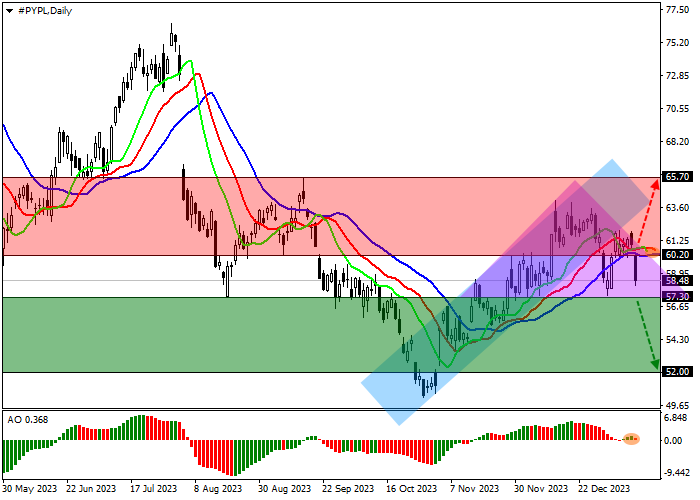
Pada grafik harian, harga masih berada di bawah garis support koridor bawah dengan batas dinamis 64.00–60.00.
Pada grafik empat jam, setelah menguji kembali garis support di 61.80, harga turun, membentuk pola pembalikan Head and shoulder dengan level implementasi di 57.30. Saat ini, pembentukan Shoulder kedua dari pola tersebut telah berakhir, setelah itu mungkin akan memulai implementasinya dengan target di 52.00.
Indikator teknis mempertahankan sinyal buy yang buruk: fast EMA pada indikator Alligator berada dekat dengan garis sinyal, dan histogram AO membentuk bar korektif di zona buy.
Tips perdagangan
Posisi sell dapat dibuka setelah harga turun dan berkonsolidasi di bawah 57.30 dengan target di 52.00. Stop loss di 59.00. Periode implementasi: 7 hari atau lebih.
Posisi buy dapat dibuka setelah harga naik dan berkonsolidasi di atas 60.20 dengan target di 65.70. Stop loss di 59.00.
Disclaimer: The content above represents only the views of the author or guest. It does not represent any views or positions of FOLLOWME and does not mean that FOLLOWME agrees with its statement or description, nor does it constitute any investment advice. For all actions taken by visitors based on information provided by the FOLLOWME community, the community does not assume any form of liability unless otherwise expressly promised in writing.


Hot
No comment on record. Start new comment.