Current trend
Last week, the XRP/USD pair had ambiguous dynamics: after the approval of bitcoin ETF in the United States, the price rose to the level of 0.6230, consolidating above the central line of Bollinger Bands, but could not stay there and resumed the decline, which continues now. Pressure on quotes is exerted by the possibility of postponing the timing of the US Federal Reserve's transition to "dovish" rhetoric due to the resumption of inflation growth in the country. In addition, the head of Ripple, Brad Garlinghouse, speaking at the economic forum in Davos, said that the company's initial public offering (IPO) is not a priority.
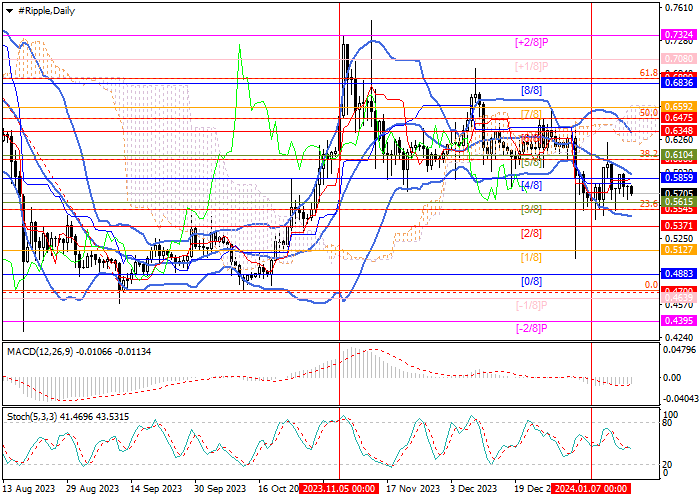
A short-term downtrend continues to form in the XRP/USD pair, as evidenced by the downward reversal of Bollinger Bands and Stochastic, as well as the stabilization of MACD in the negative zone. Now the price is close to 0.5545 (23.6% Fibonacci retracement), a breakdown of which may lead to a further decline towards the targets of 0.4883 (Murrey level [0/8]) and 0.4700 (0.0% Fibonacci retracement). The key for the "bulls" is the 0.6104 mark (Murrey level [5/8], 38.2%Fibonacci retracement) above the central line of Bollinger Bands. Its breakout will allow quotes to resume growth to the levels of 0.6592 (Murrey level [7/8]) and 0.6850 (61.8% Fibonacci retracement, Murrey level [8/8]), but so far this option of price movement in the near future seems less likely.
Support and resistance
Resistance levels: 0.6104, 0.6592, 0.6850.
Support levels: 0.5545, 0.4883, 0.4700.

Trading tips
Short positions can be opened below the 0.5545 mark with targets at 0.4883, 0.4700 and stop-loss at 0.5860. Implementation period: 5–7 days.
Long positions can be opened above 0.6104 with targets at 0.6592, 0.6850 and stop-loss at 0.5780.


Hot
No comment on record. Start new comment.