Current trend
The GBP/USD pair started the week with a decline and reached 1.2595 amid new signals about a possible postponement of the US Federal Reserve’s monetary policy adjustment.
Thus, yesterday, the regulator’s representative, Christopher Waller, said that the inflation target of 2.0% was “within striking distance” but there should be no rush to change the interest rate until it became clear that the price decline was sustainable. At the same time, according to Waller, officials should act carefully and not carry out large and rapid cuts in borrowing costs to avoid economic shocks. These statements led to the strengthening of the American currency but today, it began to lose ground again, so the GBP/USD pair rose to the area of 1.2675.
The reason for the further reversal is the publication of December British macroeconomic statistics: the consumer price index unexpectedly increased from –0.2% to 0.4% MoM and from 3.9% to 4.0% YoY, and the core indicator from –0.3% to 0.6% MoM, remaining at 5.1% instead of the predicted decrease to 4.9% YoY. Inflationary pressure in the country has increased for the first time in the last ten months, which experts attribute to the introduction of new duties on tobacco products. Treasury Secretary Jeremy Hunt tried to reassure investors by saying price declines never occur in a straight line and that the government’s measures are correct. However, market participants believe that Bank of England officials may delay the start of monetary easing until the second half of the year, although it was previously expected to begin in May, and this sentiment supports the position of the pound.
Support and resistance
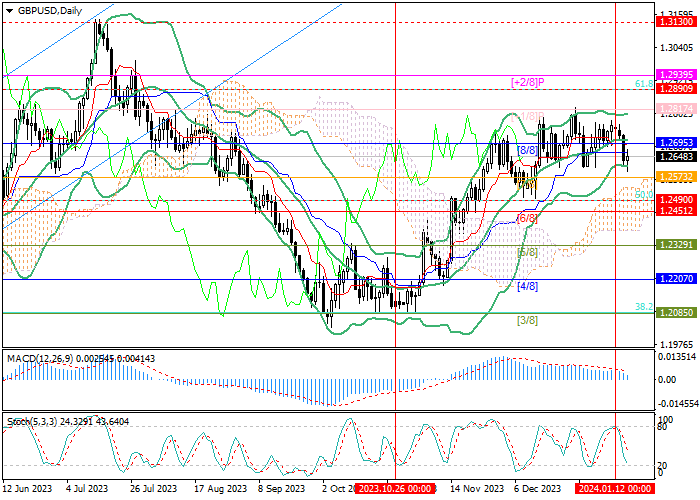
The trading instrument is showing signs of the current upward trend reversal: the price consolidated below the middle line of Bollinger Bands. To decline to the area of 1.2451 (Murrey level [6/8]), 1.2329 (Murrey level [5/8]), and 1.2207 (Murrey level  /8]), it needs to overcome 1.2573 (Murrey level [7/8]). If 1.2695 (Murrey level [8/8], middle line of Bollinger bands) is broken upward, the positive dynamics will resume to the area of 1.2817 (Murrey level [ 1/8]) and 1.2890 (Fibonacci correction 61.8%).
Technical indicators do not give a single signal: Bollinger Bands are horizontal, the MACD histogram is decreasing in the positive zone, and Stochastic is directed downwards but it is approaching the oversold zone, which does not exclude an imminent reversal.
Resistance levels: 1.2695, 1.2817, 1.2890.
Support levels: 1.2573, 1.2451, 1.2329, 1.2207.
Trading tips
Short positions may be opened below 1.2573 with the targets at 1.2451, 1.2329, 1.2207, and stop loss around 1.2650. Implementation time: 5–7 days.
Long positions may be opened above 1.2695 with the targets at 1.2817, 1.2890 and stop loss around 1.2610.


Hot
No comment on record. Start new comment.