Current trend
One of the leading US indices, NQ 100, is trading around 16780.0, continuing its corrective dynamics against the backdrop of the start of the reporting season and growth in the bond market.
Large US banks confirmed the negative forecasts of analysts, reporting significantly worse than the previous period. Morgan Stanley posted revenue of 12.90 billion dollars, which beat estimates of 12.79 billion dollars but fell short of the 13.3 billion dollars recorded a quarter earlier. Earnings per share were 0.85 dollars, the lowest since 2018, missing the 1.38 dollars reported in the prior period and the 1.08 dollars expected by analysts.
Goldman Sachs Group's financial results were much better than its rival's, but revenue of 11.32 billion dollars was also below the prior-year period's 11.82 billion dollars. However, the company managed to record earnings per share of 5.48 dollars, which surpassed the 5.47 dollars recorded a quarter earlier.
Positive dynamics remain in the bond market: 10-year bonds are trading at a rate of 4.060%, which exceeds the January 12 low at 3.922%, the yield on 20-year bonds is 4.411%, which is higher than the local low in January at 4.281%, and 30-year bonds are already close to the local high of early December at 4.300%.
The growth leaders in the index are AMD Inc. ( 8.31%), O’Reilly Automotive Inc. ( 3.90%), MongoDB ( 3.54%), Cadence Design Systems Inc. ( 3.37%).
Among the leaders of the decline are ANSYS Inc. (-5.50%), The Trade Desk Inc. (-4.78%), PayPal Holdings Inc. (-4.18%).
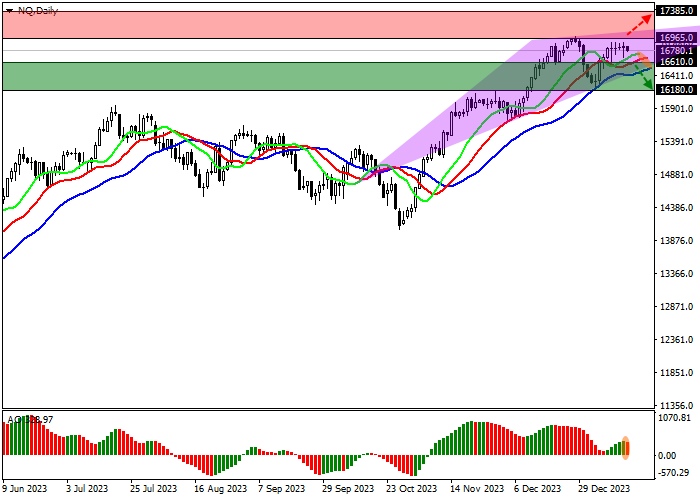
Support and resistance
On the daily chart, the index quotes continue the global correction, which is developing within the framework of a possible Head and Shoulders reversal pattern with the implementation level around 16200.0.
Technical indicators still hold a buy signal, which is actively weakening: fast EMAs on the Alligator indicator are above the signal line, and the AO histogram is forming new corrective bars, falling in the buy zone.
Support levels: 16610.0, 16180.0.
Resistance levels: 16965.0, 17385.0.

Trading tips
If the asset continues declining and the price consolidates below 16610.0, short positions can be opened with the target at 16180.0. Stop-loss — 16800.0. Implementation time: 7 days and more.
If the asset continues growing locally and consolidates above 16965.0, long positions with the target at 17385.0 will be relevant. Stop-loss — 16800.0.


Hot
No comment on record. Start new comment.