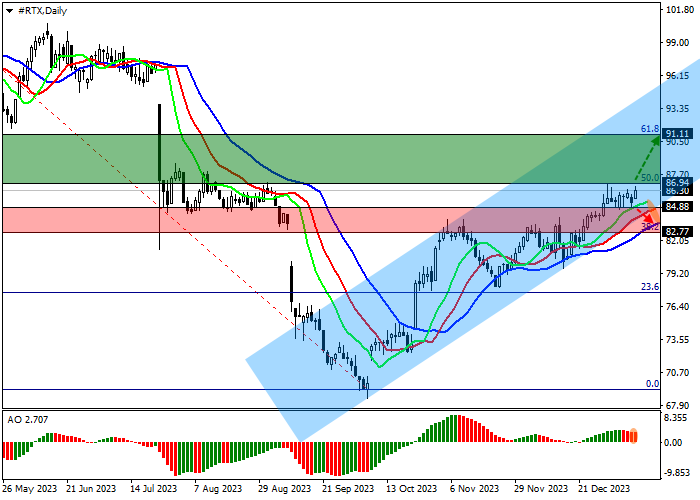
Saham RTX Corp., konglomerat kedirgantaraan dan pertahanan AS, naik, ditradingkan pada 86.00.
Pada grafik harian, harga melanjutkan koreksi ke atas lokal menuju garis resistance channel 91.00–85.00.
Pada grafik empat jam, jelas bahwa target pertumbuhan global adalah koreksi penuh Fibonacci 61.8% di 91.11, dan harga mungkin mencapainya setelah berkonsolidasi di atas koreksi menengah Fibonacci 50.0% di 86.94, mendekati saat ini.
Indikator teknis menjaga sinyal beli: fast EMA pada indikator Alligator berada pada jarak yang cukup dari garis sinyal, dan histogram AO membentuk batang korektif di zona beli.
Tips perdagangan
Posisi buy dapat dibuka setelah harga naik dan berkonsolidasi di atas 86.94 dengan target di 91.11. Stop loss – 85.50. Periode implementasi: 7 hari atau lebih.
Posisi sell dapat dibuka setelah harga turun dan berkonsolidasi di bawah 84.88 dengan target di 82.77. Stop loss – 85.50.
Disclaimer: The content above represents only the views of the author or guest. It does not represent any views or positions of FOLLOWME and does not mean that FOLLOWME agrees with its statement or description, nor does it constitute any investment advice. For all actions taken by visitors based on information provided by the FOLLOWME community, the community does not assume any form of liability unless otherwise expressly promised in writing.


Hot
-THE END-