Current trend
The USD/JPY pair is showing moderate growth, recovering from last week's "bearish" close. The instrument is testing 145.15 for a breakout, while American markets are closed on the occasion of Martin Luther King Day. Investors analyze Friday's statistics on producer inflation in the US.
In December, the Producer Price Index showed a decrease of 0.1%, repeating the dynamics of the previous month, while analysts expected 0.1%, and in annual terms the indicator accelerated from 0.8% to 1.0% with expectations at 1.3%. The PPI excluding Food and Energy on an annualized basis slowed down from 2.0% to 1.8% with a forecast of 1.9%, and on a monthly basis it remained at zero with preliminary estimates of 0.2%.
Meanwhile, the yen is supported by macroeconomic data from Japan: Bank Lending volumes in December increased from 2.8% to 3.1%, while experts expected 2.7%; the Current Situation index from Eco Watchers strengthened from 49.5 points to 50.7 points, while analysts expected 49.9 points, and the Economic Outlook, on the contrary, dropped from 49.4 points to 49.1 points.
Economists expect that the Bank of Japan in its quarterly outlook report will cut its preliminary estimate of core inflation, which it considers a key indicator of the broader price trend, from the current 2.8% due to a recent decline in crude oil prices to 1.9% for both fiscal year 2024, beginning in April, and 2025. Given that consumer price growth has exceeded the 2.0% threshold for more than a year, market participants believe that officials will abandon ultra-loose monetary policy and adjust the interest rate from the level of -0.10%, where it has been since 2016.
Support and resistance
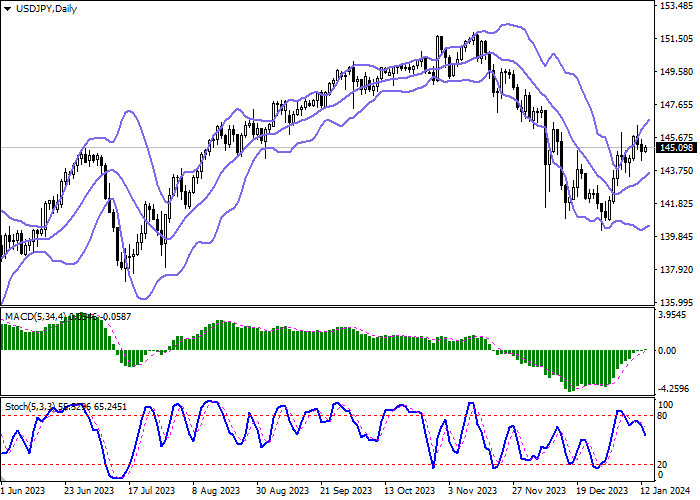
Bollinger Bands on the daily chart show a steady increase. The price range expands from above, freeing a path to new local highs for the "bulls". MACD grows, preserving a stable buy signal (located above the signal line). The indicator is also trying to consolidate above the zero level. Stochastic, having shown a rebound from the level of "80" last week, is developing confident downward dynamics, signaling in favor of the development of a full-fledged downward trend in the ultra-short term.
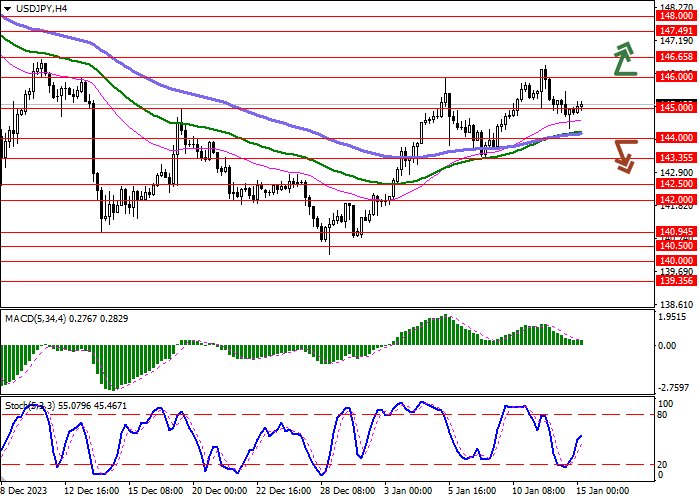
Resistance levels: 145.00, 146.00, 146.65, 147.49.
Support levels: 144.00, 143.35, 142.50, 142.00.
Trading tips
Short positions may be opened after a breakdown of 144.00 with the target at 142.50. Stop-loss — 145.00. Implementation time: 2-3 days.
The return of the "bullish" trend with the breakout of 146.00 may become a signal for new purchases with the target of 147.49. Stop-loss — 145.30.


Hot
No comment on record. Start new comment.