Current trend
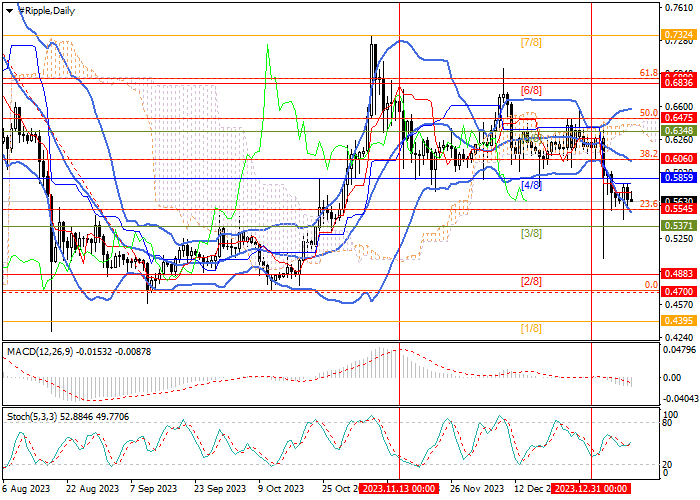
The XRP/USD pair has been declining for the second week in a row, adjusting to a long-term uptrend: currently, the price has left the lateral range of 0.6475–0.5859 (50.0% Fibonacci retracement, Murrey level [0/8]), within which it has been moving since mid-November and is close to the level of 0.5545 (23.6% Fibonacci retracement), with a breakdown of which the decline may continue towards the targets of 0.4883 (Murrey level [2/8]) and 0.4700 (0.0% Fibonacci retracement).
The key for the "bulls" is the 0.6060 mark (38.2% Fibonacci retracement), supported by the central line of Bollinger Bands, the breakdown of which will allow the quotes to resume growth to 0.6475 (50.0% Fibonacci retracement), 0.6890 (61.8% Fibonacci retracement, Murrey level [6/8]), 0.7324 (Murrey level [7/8]).
In the near future, a further decline in the XRP/USD pair seems more likely, but the situation may be affected by the decision of the US Securities and Exchange Commission (SEC) to approve the launch of a bitcoin ETF. If officials approve a new exchange-traded instrument, one shouldn't exclude an abrupt increase in quotes and a change in the emerging downtrend.
Support and resistance
Technical indicators confirm a continuation of the decline: Bollinger Bands are reversing down, MACD is increasing in the negative zone, Stochastic is horizontal.
Resistance levels: 0.6060, 0.6475, 0.6890, 0.7324.
Support levels: 0.5545, 0.4883, 0.4700.

Trading tips
Short positions can be opened below the 0.5545 mark with targets at 0.4883, 0.4700 and stop-loss around 0.5860. Implementation period: 5–7 days.
Long positions can be opened above the level of 0.6060 with targets at 0.6475, 0.6890, 0.7324 and stop-loss around 0.5800.


Hot
No comment on record. Start new comment.