Current trend
The quotes of WTI Crude Oil have been held in the main lateral range of 75.00–70.00 for the fifth week, but this week there is an ambiguous trading dynamics: at first, the price reached the area of 70.10, but the last two sessions it has been actively restoring lost positions. The market is influenced by two opposite factors: geopolitical tensions in the Middle East and the complications of offshore oil transportation, but the more rapid uptrend is still held back by fears of a slowdown in the world's leading economies, primarily European and Chinese.
The international maritime coalition has not yet been able to block attacks by the Yemeni Houthis on merchant ships in the Red Sea, and leading carriers are forced to change shipping routes, which significantly increases the time and cost of delivery. According to the statements of the US presidential administration, the current crisis has already affected 20.0% of global maritime trade, and the situation is only getting worse.
Local support for prices is also provided by a decrease in both production in Libya and oil reserves in the United States. Over the weekend, the National Oil Corporation of Libya (NOC) announced the shutdown of the country's largest field, Sharara, capable of producing 300.0 thousand barrels of oil per day, and a report published yesterday from the American Petroleum Institute (API) recorded a reduction in reserves by 5,215 million barrels at once. During the day, investors await the publication of a similar document from the Energy Information Administration of the U.S. Department of Energy (EIA): according to forecasts, reserves of "black gold" will decrease by 0.675 million barrels, providing additional support to energy prices.
Support and resistance
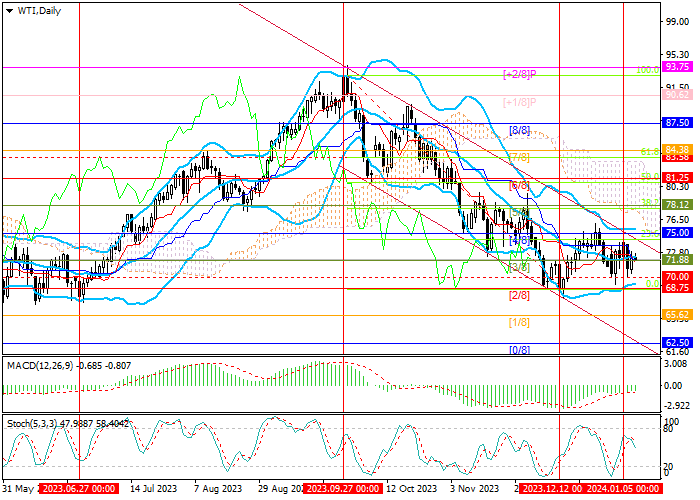
The instrument is located within a long-term descending channel. The key for the "bulls" is the level of 75.00 (Murray level [4/8]), at the breakdown of which the quotes will be able to leave the descending channel and resume growth to 81.25 (Murrey level [6/8]) and 84.38 (Murrey level [7/8]). If the level of 70.00 is broken down, the decline will resume to the area of 65.62 (Murrey level [1/8]) and 62.50 (Murrey level [0/8]).
Technical indicators do not give a clear signal: Bollinger Bands are horizontal, MACD is stable in the negative zone, while Stochastic has reversed down.
Resistance levels: 75.00, 81.25, 84.38.
Support levels: 70.00, 65.62, 62.50.
Trading tips
Short positions can be opened below the 70.00 mark with targets at 65.62, 62.50 and stop-loss around 72.10. Implementation period: 5–7 days.
Long positions can be opened above the 75.00 mark with targets at 81.25, 84.38 and stop-loss around 71.70.


Hot
No comment on record. Start new comment.