Current trend
During the Asian session, prices for WTI Crude Oil are rising slightly, testing 72.70: the asset is preparing to end the week with a slight increase, while investors are in no hurry to open new positions ahead of the publication of the US labor market report for December.
Positive dynamics are developing against reports of explosions in the Iranian city of Kerman at the grave of the former commander of the Al-Quds special forces of the Islamic Revolutionary Guard Corps, General Qasem Soleimani, on his memorial day and the suspension of production at a field in Libya, which supplied about 300.0K barrels per day against protests.
Analysts expect the US economy to add about 170.0K new nonfarm payrolls in December after growing by 199.0K earlier, with the unemployment rate rising to 3.8% from 3.7% and average hourly wages falling from 4.0% to 3.9%. In addition, the dollar is under pressure of expectations of the launch of a cycle of interest rate cuts by the US Federal Reserve: the minutes of the regulator’s December meeting, published this week, reflected its hopes for at least a three-fold reduction in the rate of 0.25% each this year.
An additional factor supporting the asset was data on oil reserves dynamics: a report from the Energy Information Administration of the US Department of Energy (EIA) reflected a correction in the indicator for the week of December 29 by –5.503M barrels after –7.114M barrels earlier compared to forecasts of –3.725M barrels.
A period of global correction continues in the market, and according to the latest report from the US Commodity Futures Trading Commission (CFTC), last week, the number of net speculative positions in oil increased from 182.7K to 199.3K. As for the balance sheet, the upward trend continues: the balance of the “bulls” on positions with swap dealers amounted to 18.382K against 45.186K for the “bears”, and last week, buyers slightly increased the number of contracts by 0.849K, while sellers reduced them by only 51, confirming the wait-and-see approach position of traders during the transition period.
Support and resistance
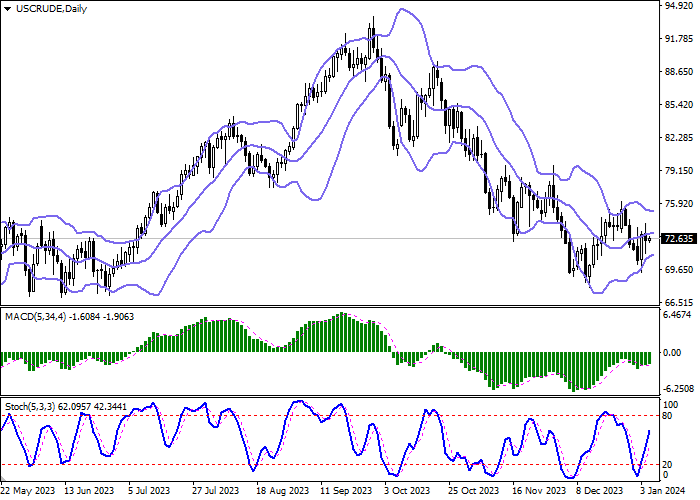
On the daily chart, Bollinger Bands are moving flat: the price range narrows, remaining quite spacious for the current market activity. The MACD indicator grows, maintaining a poor buy signal (the histogram is above the signal line). Stochastic shows more confident growth and quickly approaches its highs, indicating that the instrument may become overbought in the ultra-short term.
Resistance levels: 74.00, 75.00, 76.00, 77.00.
Support levels: 71.77, 71.00, 70.00, 69.00.


Hot
No comment on record. Start new comment.