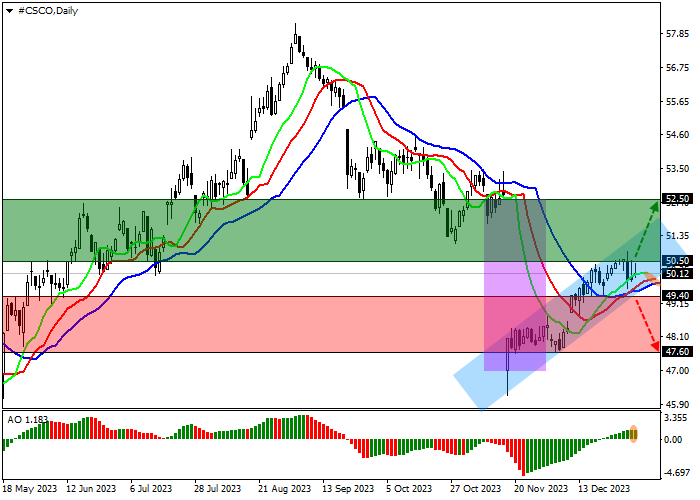
Shares of Cisco Systems Inc., an American manufacturer and supplier of network equipment for large holdings and telecommunications companies, are adjusted at 50.00.
On the daily chart, the instrument is trying to work out the recent price gap of 52.50–47.00.
On the four-hour chart, the potential for continued growth remains, and the movement is developing within the local corridor with dynamic boundaries of 51.00–49.40. Despite the corrective declines, the quotes have already filled more than half of the global gap, approaching 52.50. However, after exiting the local downward channel and breaking 49.50, short positions will become relevant.
Technical indicators are holding a buy signal: fast EMA on the Alligator indicator are above the signal line, and the AO histogram is forming corrective bars in the buy zone.
Trading tips
Long positions may be opened after the price rises and consolidates above 50.50 with the target at 52.50. Stop loss is around 50.00. Implementation period: 7 days or more.
Short positions may be opened after the price declines and consolidates below 49.40 with the target at 47.60. Stop loss – 50.00.
Disclaimer: The content above represents only the views of the author or guest. It does not represent any views or positions of FOLLOWME and does not mean that FOLLOWME agrees with its statement or description, nor does it constitute any investment advice. For all actions taken by visitors based on information provided by the FOLLOWME community, the community does not assume any form of liability unless otherwise expressly promised in writing.


Hot
No comment on record. Start new comment.