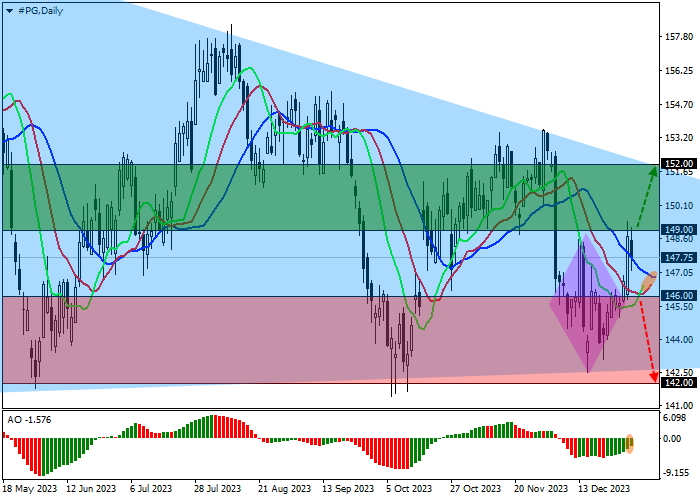
Shares of The Procter & Gamble Co., one of the leaders in the global consumer goods market, are moving in a corrective trend at 148.00.
On the daily chart, the price is within the global Triangle pattern with gradually narrowing boundaries of 142.00–154.00, approaching the resistance line.
On the four-hour chart, a new wave of growth has just begun, and the recent exit of quotes from the Diamond pattern with the breakout of the resistance level of 147.00 strengthens the upward signal. The key resistance level is the December 13 high of 148.40, which the asset is trying to overcome.
Technical indicators are slowing down the sell signal: fast EMAs on the Alligator indicator are approaching the signal line, narrowing the range of fluctuations, and the AO histogram forms ascending bars, declining in the sell zone.
Trading tips
Long positions may be opened after the price rises and consolidates above 149.00 with the target at 152.00. Stop loss – 148.00. Implementation period: 7 days or more.
Short positions may be opened after the price declines and consolidates below 146.00 with the target at 142.00. Stop loss – 148.00.
Disclaimer: The content above represents only the views of the author or guest. It does not represent any views or positions of FOLLOWME and does not mean that FOLLOWME agrees with its statement or description, nor does it constitute any investment advice. For all actions taken by visitors based on information provided by the FOLLOWME community, the community does not assume any form of liability unless otherwise expressly promised in writing.


Hot
No comment on record. Start new comment.