Current trend
The leading US economy index S&P 500 is correcting at around 4708.0. Dynamics in the stock market continue to depend on bond yields and new macroeconomic reports.
Today, labor market data will be published, which traditionally have a key influence on the US Federal Reserve's decisions on monetary policy: according to forecasts, Nonfarm Payrolls may add 115.0 thousand after an increase of 103.0 thousand in the previous month. In addition, Initial Jobless Claims are expected to decrease to 216.0 thousand from 218.0 thousand recorded last week, and Continuing Jobless Claims may increase from 1.750 million to 1.883 million.
Today, the index's component companies will begin publishing their financial results. In particular, analysts expect the largest pharmacy chain Walgreens Boots Alliance Inc. revenue of 34.88 billion dollars, down slightly from 35.40 billion dollars in the prior-year quarter, and earnings per share expected to be 0.63 dollars, down from 0.67 dollars reported in the prior period.
In the domestic bond market, the global decline has temporarily paused, with the 10-year yield at 3.935%, up from 3.795% at the end of last year.
The growth leaders in the index are Eli Lilly and Co. ( 4.29%), Marathon Petroleum Corp. ( 3.62%), EOG Resources Inc. ( 2.78%), Valero Energy Corp. ( 2.37%).
Among the leaders of the decline are Insulet Corp. (-6.91%), Waters Corp. (-6.89%), Enphase Energy Inc. (-6.56%).
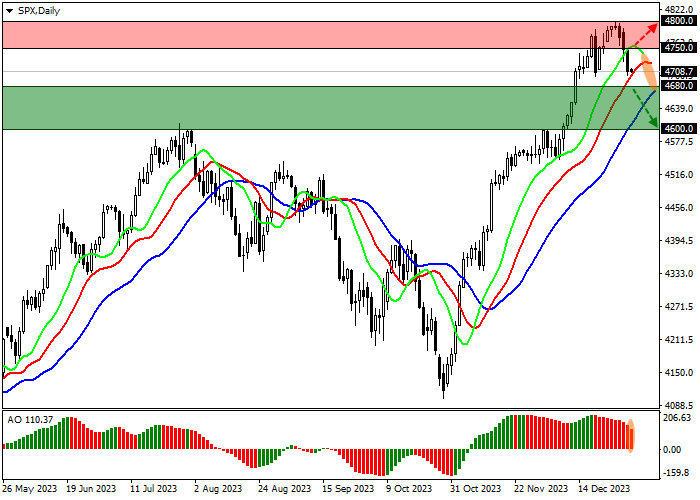
Support and resistance
Index quotes continue their local correction, reversing in the direction of decline on the daily chart.
Technical indicators are holding a global buy signal, which is actively slowing down: fast EMAs on the Alligator indicator are approaching the signal line, and the AO oscillator histogram, being in the buy zone, is forming descending bars.
Support levels: 4680.0, 4600.0.
Resistance levels: 4750.0, 4800.0.
Trading tips
If the asset reverses and declines and the price consolidates below the local support level of 4680.0, short positions can be opened with the target at 4600.0. Stop-loss — 4710.0. Implementation time: 7 days and more.
If the asset continues growing and the price consolidates above the local resistance level of 4750.0, long positions will be relevant with target at 4800.0. Stop-loss — 4730.0.


Hot
No comment on record. Start new comment.