Current trend
After reaching two-year highs, the SOL/USD pair has been correcting downwards for the second week, supported by two main factors: partial profit-taking by traders during the Christmas holidays, as well as investor reaction to the minutes of the latest meeting of the US Federal Open Market Committee (FOMC). Thus, officials hoped to begin reducing interest rates by the end of next year but noted continued uncertainty, and some even admitted the possibility of a new increase in borrowing costs if necessary.
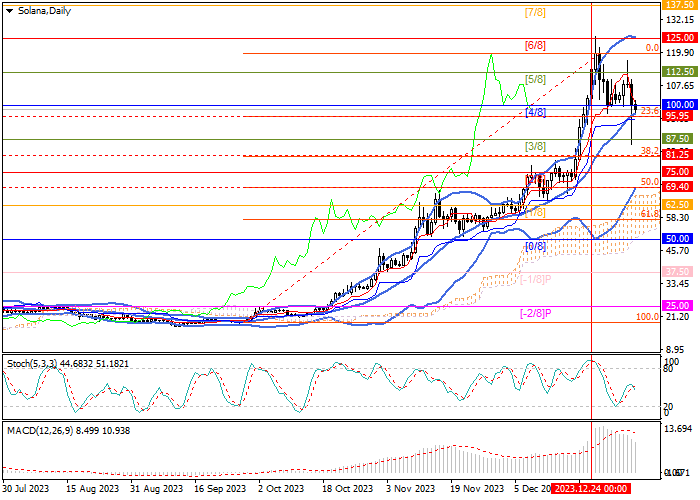
Against the background, the SOL token dropped to 85.65 but then partially restored its position: the trading instrument is at 95.95 (the middle line of Bollinger bands, Fibonacci correction of 23.6%), and if it consolidates below it, the negative dynamics will continue to the area of 81.25 (correction Fibonacci 38.2%) and 69.40 (Fibonacci retracement 50.0%). The key “bullish” level is 112.50 (Murrey level [5/8]), and after its breakout, the movement will continue with the targets of 125.00 (Murrey level [6/8]) and 137.50 (Murrey level [7/8]).
Technical indicators do not give a single signal: Bollinger Bands are directed upward, but the MACD histogram decreases in the positive zone, and Stochastic reverses downwards. Soon, the price may consolidate below the middle line of Bollinger bands and change the current upward trend.
Support and resistance
Resistance levels: 112.50, 125.00, 137.50.
Support levels: 95.95, 81.25, 69.40.
Trading tips
Short positions may be opened below 95.95 with the targets at 81.25, 69.40, and stop loss 104.50. Implementation time: 5–7 days.
Long positions may be opened above 112.50 with the targets at 125.00, 137.50, and stop loss around 105.00.


Hot
No comment on record. Start new comment.