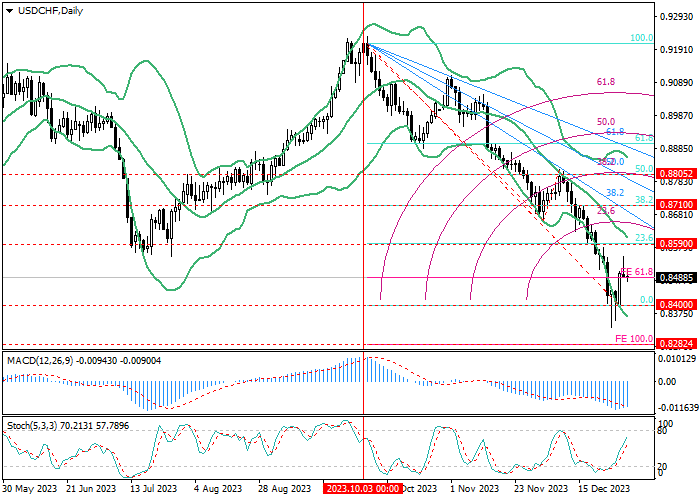
USD/CHF, D1
On the daily chart, the price is trying to start an upward correction from the area of 0.8400 (0.0% correction). After the breakout of 0.8590 (23.6% correction, the middle line of Bollinger Bands), the price may reach 0.8710 (38.2% correction) and 0.8805 (correction of 50.0%), but the quotes will have to break through the downward fan. If the asset re-consolidates below 0.8400, the decline can resume to 0.8282 (100.0% extension).
Technical indicators reflect the continuation of the downward trend: Bollinger bands are reversing, and the MACD histogram is stabilizing in the negative zone. However, an upward reversal of Stochastic does not exclude corrective growth.

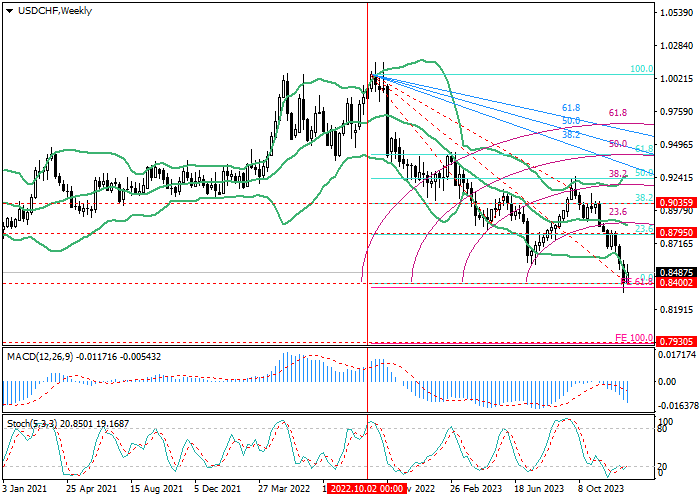
USD/CHF, W1
On the weekly chart, the quotes are declining as part of a long-term downward trend and are currently testing 0.8400 (0.0% correction). After consolidation below it, the asset can reach 0.7930 (100.0% expansion). Otherwise, a corrective growth to 0.8795 (23.6% correction, middle line of Bollinger bands) is expected.
Technical indicators do not give a single signal: Bollinger bands reverse downwards, and the MACD histogram is increasing in the negative zone. However, Stochastic may leave the oversold zone soon.
Support and resistance
The development of downward dynamics is more likely: with a breakdown of 0.8400 (0.0% correction, D1, and W1), its target will be the area of 0.8282 (100.0% extension, D1) and 0.7930 (100.0% extension, W1). If 0.8590 (correction of 23.6%, D1) is broken, growth to the area of 0.8710 (correction of 38.2%, D1) and 0.8805 (correction of 50.0%, D1, correction of 23.6%, W1) is expected.
Resistance levels: 0.8590, 0.8710, 0.8805.
Support levels: 0.8400, 0.8282, 0.7930.
Trading tips
Short positions may be opened below 0.8400 with the targets at 0.8282, 0.7930 and stop loss around 0.8490. Implementation time: 5–7 days.
Long positions may be opened above 0.8590 with the targets at 0.8710, 0.8805 and stop loss around 0.8500.


Hot
No comment on record. Start new comment.