Current trend
The USD/JPY pair is showing noticeable growth, quickly recouping losses incurred at the end of last week, when local lows dated July 28, 2023 were updated. Technical factors contribute to the upward dynamics, while the fundamental background in the market changes little.
As before, investors are assessing the prospects for raising interest rates by the US Federal Reserve, suggesting that the first step in this direction could be taken during the March meeting. The position of the yen, in turn, is strengthening against the backdrop of statements by representatives of the Bank of Japan, who previously stated their readiness to reconsider the loose monetary policy if inflationary pressure in the country continues to increase. However, the Governor of the Bank of Japan, Kazuo Ueda, did not give any specific deadlines, noting that the regulator will closely monitor all statistics coming to the market and take into account external economic factors.
On Thursday and Friday, the December labor market report will be published in the United States, which could have a significant impact on the future decisions of the American financial regulator. Forecasts suggest an increase in the Unemployment Rate from 3.7% to 3.8%, the Nonfarm Payrolls may decrease from 199.0 thousand to 163.0 thousand, and the Average Hourly Earnings may adjust from 4.0 % to 3.9%. On Friday, Japan will publish data on the December Manufacturing PMI from Jibun Bank, as well as on the level of Consumer Confidence.
Support and resistance
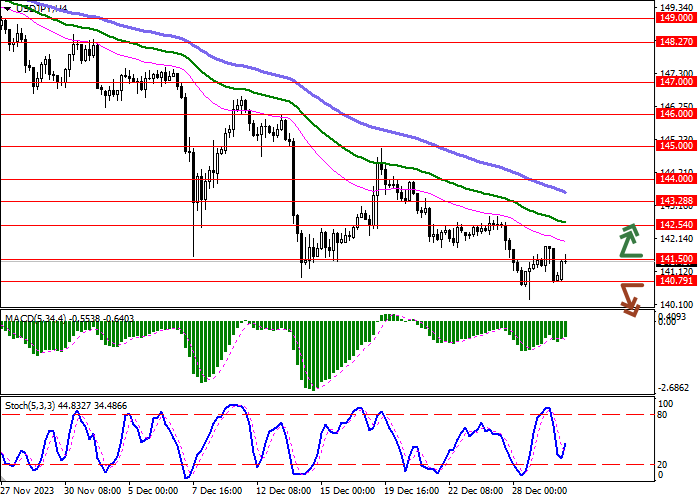
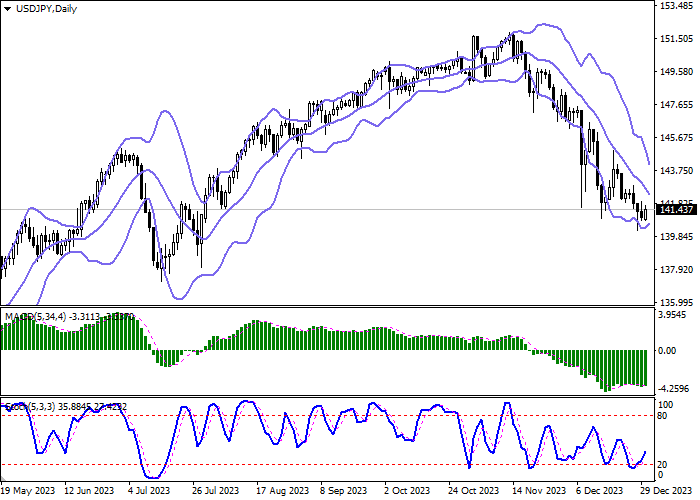
Bollinger Bands on the daily chart show a steady decline. The price range is narrowing, reflecting ambiguous nature of trading in the ultra-short term. MACD indicator is reversing upwards forming a new buy signal (the histogram is about to consolidate above the signal line). Stochastic shows similar dynamics, retreating from its lows that signal the risks of oversold US dollar in the ultra-short term.
Resistance levels: 141.50, 142.54, 143.28, 144.00.
Support levels: 140.79, 139.58, 138.50, 137.50.
Trading tips
Long positions can be opened after a breakout of 141.50 with the target of 142.54. Stop-loss — 140.79. Implementation time: 1-2 days.
The return of a "bearish" trend with the breakdown of 140.79 may become a signal for new short positions with the target at 139.58. Stop-loss — 141.50.


Hot
No comment on record. Start new comment.