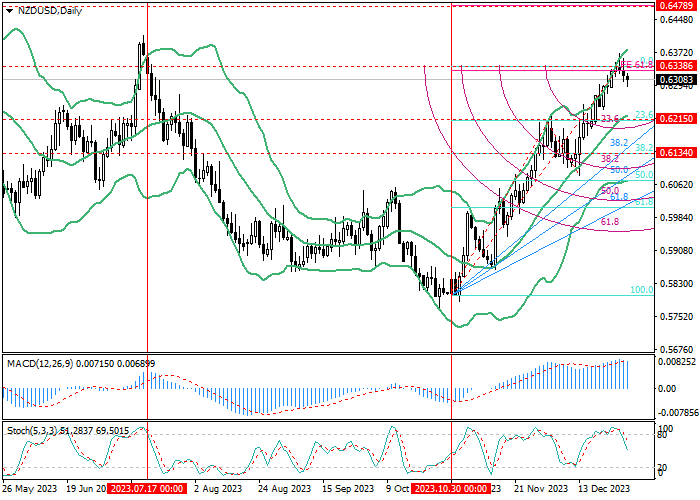
NZD/USD, D1
On the D1 chart, the price is attempting to start a downward correction from the level of 0.6338 (0.0% retracement, near six-month highs), the targets of which may be 0.6215 (23.6% retracement, the central line of Bollinger Bands) and 0.6134 (38.2% retracement). If the quotes consolidate above the level of 0.6338, the growth will be able to continue to the level of 0.6478 (100.0% expansion). Technical indicators confirm the continuation of the uptrend: Bollinger Bands are directed upwards, MACD is increasing in the positive zone, and the exit of Stochastic from the overbought zone does not exclude the development of a corrective decline, but its potential is limited.
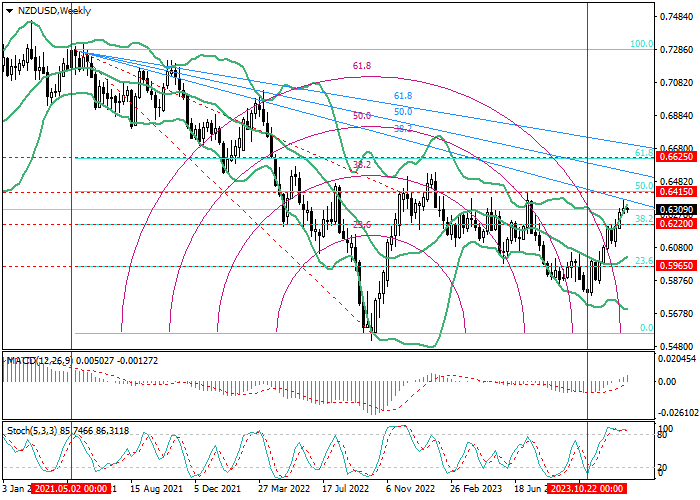
NZD/USD, W1
On the W1 chart, the price has been rising for the third month in a row: quotes have consolidated above the level of 0.6220 (38.2% retracement) and continue to move upward to 0.6415 (50.0% retracement). With a repeated breakdown of the 0.6220 mark, the decline of the instrument may resume to 0.5965 (23.6% retracement, the central line of Bollinger Bands), but such a scenario seems less likely. Technical indicators indicate the formation of an uptrend: Bollinger Bands are reversing up, MACD is increasing in the positive zone, while Stochastic is horizontal in the overbought zone.
Support and resistance
Soon, the continued growth is expected: after the breakout of the 0.6338 level (0.0% retracement, D1), the price will be able to reach 0.6415 (50.0% retracement, W1) and 0.6478 (100.0% expansion, D1). If the level of 0.6215 is broken down (23.6% retracement, D1, and 38.2% retracement, W1), the decline may continue to 0.6134 (38.2% retracement, D1).
Resistance levels: 0.6338, 0.6415, 0.6478.
Support levels: 0.6215, 0.6134.
Trading tips
Long positions can be opened above 0.6338 with targets at 0.6415, 0.6478 and stop-loss around 0.6290. Implementation period: 5–7 days.
Short positions should be opened below the level of 0.6215 with the target at 0.6134 and stop-loss at 0.6265.


Hot
No comment on record. Start new comment.