Today, we present you a mid-term investment overview of the XPT/USD pair.
From November to December last year, the demand for platinum began to increase, levelling the gap in positions with other metals: for example, XPT quotes are now held near 990.0 dollars, and RA – at 1100.0 dollars, while in early summer the spread was 470.0 dollars, and the reduction itself occurred to a greater extent amid the strengthening of the exchange rate platinum.
In 2024, the World Platinum Investment Council (WPIC) forecasts a 6.0% decrease in demand for the metal compared to the level of 2023 to 7.66 million ounces, but this decrease is expected amid a sharp increase in total demand to a record 8.15 million ounces by the end of the year, which is 26.0% higher than in 2022. In the automotive industry, the volume of metal consumed increased by 14.0% to 3.26 million ounces, and in other industries to 2.65 million ounces. Investment demand has also increased significantly, and by the end of 2023 may amount to 385.0 thousand ounces, of which the bullion demand will amount to 305.0 thousand ounces, an increase of 36.0% over the year. Thus, in 2023, WPIC expects a record platinum shortage in the global market of 1.07 million ounces, and in 2024 this figure will decrease to 353.0 thousand ounces.
In addition to the underlying fundamental factors, the continued growth of the XPT/USD pair is confirmed by technical indicators: on the W1 chart, the instrument is trading within the descending channel of 1100.00–720.00, confidently approaching the upper border of the range.
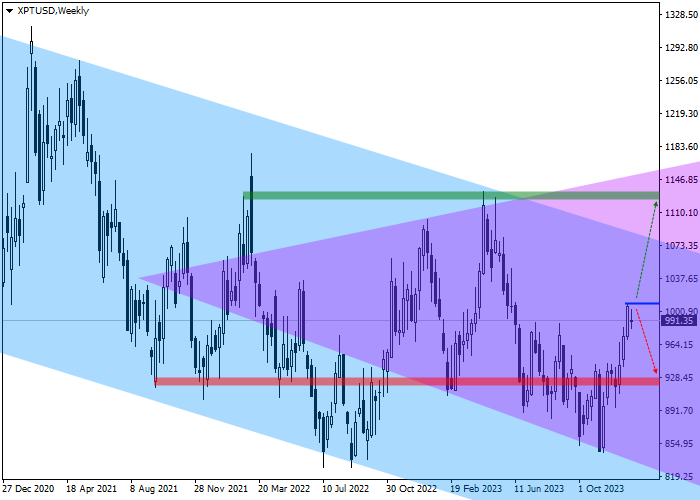
At the moment, the price has indicated an attempt to consolidate above the local maximum of September 1, 2023 at around 980.00, which turned out to be successful. If consolidated above it, the growth of quotes may continue to the area of last year’s highs, near 1120.00.
Key levels can be seen on the D1 chart.
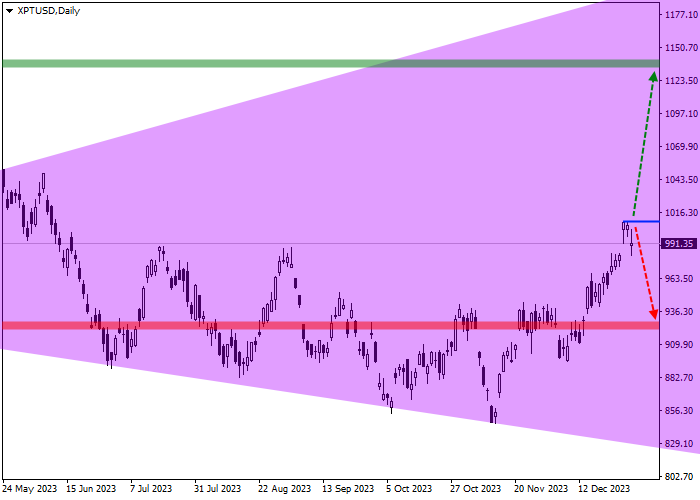
As can be seen on the H4 chart, the local price increase develops within the framework of the "expanding formation" pattern, where the current growth acts as the fourth mandatory wave and very often exceeds the highs of the third wave, which are located around the 1120.00 mark.
A buy signal cancellation zone is located at 930.00. In the event of a price reversal and a return to a downtrend, as well as reaching this zone, the upward scenario will either be canceled or postponed, and open positions should be liquidated.
There is a target zone in the area of the April maximum of 1130.00; if it is reached, profit should be taken on open buy positions.
In more detail, trade entry levels can be evaluated on the H4 chart.
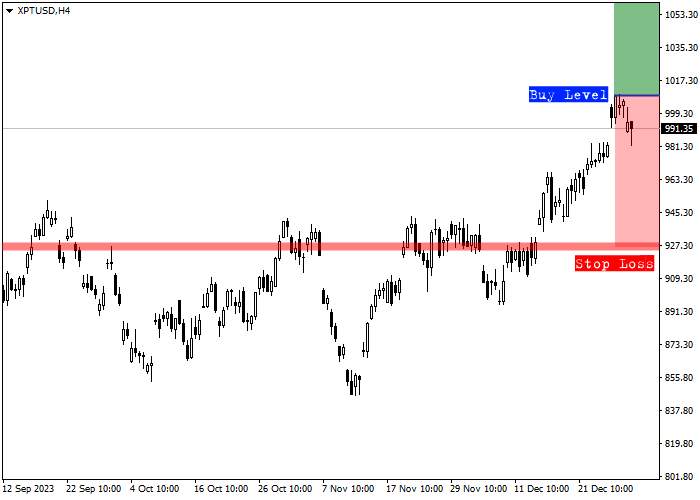
The entry level for buy transactions is located at 1000.00, and a local signal may be received in the near future. Technically, overcoming the local maximum of last month will be implemented, after which there will be no significant resistance on the way of the price path to the target level of 1130.00, and positions can be implemented.
Given the average daily volatility of the trading instrument over the past month, which is 768.0 points, movement to the target zone of 1130.00 may take approximately 49 trading sessions, however, with increased dynamics, this time may be reduced to 32 trading days.


Hot
No comment on record. Start new comment.