Saham Alcoa Corp., salah satu produsen aluminium terbesar dunia, terkoreksi di 32.00.
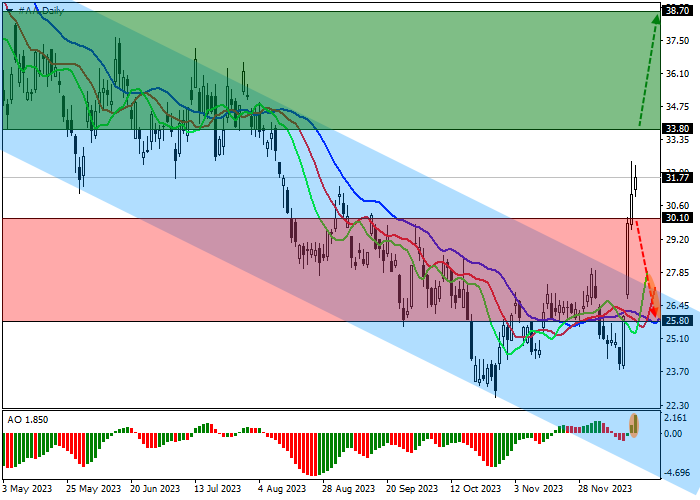
Pada grafik harian, harga meninggalkan koridor penurunan global dengan batas dinamis 22.00–27.00, menembus level resistance 27.80.
Pada grafik empat jam, potensi pertumbuhan lebih lanjut terlihat cukup tinggi, dan konsolidasi di atas harga tertinggi lokal di 30.00 menjadi penanda terakhir berlanjutnya dinamika positif dengan target global di sekitar harga tertinggi awal Mei di 39.00.
Indikator teknis mempertahankan sinyal beli yang stabil: kisaran fluktuasi EMA pada indikator Alligator mengarah ke atas, dan histogram AO membentuk batang korektif di zona beli.
Tips perdagangan
Posisi buy dapat dibuka setelah harga naik dan berkonsolidasi di atas 33.80 dengan target di 38.70. Stop loss – 31.00. Periode implementasi: 7 hari atau lebih.
Posisi sell dapat dibuka setelah harga turun dan berkonsolidasi di bawah 30.10 dengan target di 25.80. Stop loss sekitar 32.00.
Disclaimer: The content above represents only the views of the author or guest. It does not represent any views or positions of FOLLOWME and does not mean that FOLLOWME agrees with its statement or description, nor does it constitute any investment advice. For all actions taken by visitors based on information provided by the FOLLOWME community, the community does not assume any form of liability unless otherwise expressly promised in writing.


Hot
No comment on record. Start new comment.