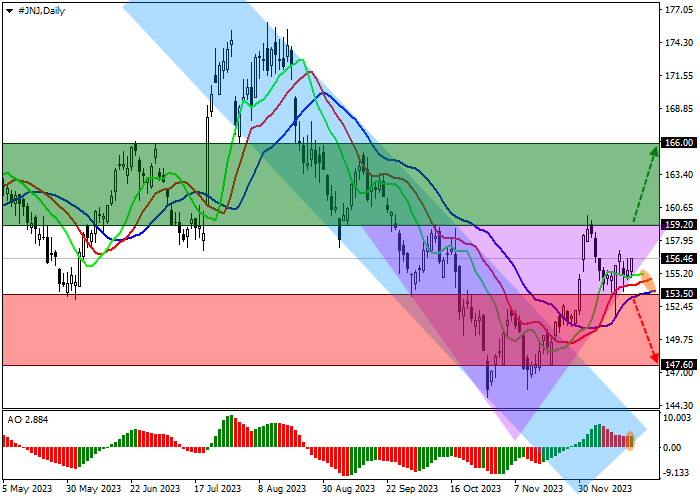
Saham Johnson & Johnson, salah satu perusahaan ritel terkemuka dunia, terkoreksi di 156.00.
Pada grafik harian, harga berada dalam tren penurunan global, mencoba menjauh dari garis resistance channel dengan batas dinamis 145.00–153.00.
Pada grafik empat jam, kemungkinan perubahan tren secara tidak langsung dikonfirmasi oleh adanya pola pembalikan Head and shoulder dengan Neckline di sekitar harga tertinggi lokal di 159.00, setelah berkonsolidasi di atasnya, aset dapat mencapai harga tertinggi bulan Januari di 166.00.
Indikator teknis menahan sinyal beli: kisaran fluktuasi EMA pada indikator Alligator meluas ke atas, dan histogram AO membentuk bilah ke atas di atas level transisi.
Tips perdagangan
Posisi buy dapat dibuka setelah harga naik dan berkonsolidasi di atas 159.20 dengan target di 166.00. Stop loss – 156.00. Periode implementasi: 7 hari atau lebih.
Posisi sell dapat dibuka setelah harga turun dan berkonsolidasi di bawah 153.50 dengan target di 147.60. Stop loss – 156.00.
Disclaimer: The content above represents only the views of the author or guest. It does not represent any views or positions of FOLLOWME and does not mean that FOLLOWME agrees with its statement or description, nor does it constitute any investment advice. For all actions taken by visitors based on information provided by the FOLLOWME community, the community does not assume any form of liability unless otherwise expressly promised in writing.


Hot
No comment on record. Start new comment.