Current trend
Last week, the BTC/USD pair had mixed dynamics, influenced by monetary factors. First, quotes corrected significantly to the area of 40165.00 against the backdrop of the publication of November data on the American labor market, which could have been a signal for US Federal Reserve officials to postpone the start of easing monetary conditions. At the last meeting, the regulator kept the cost of borrowing in the target range of 5.25-5.50% and predicted at least a threefold reduction next year. These decisions led to the restoration of the position of the BTC/USD pair and an increase in quotes to the area of 43500.00. However, the price failed to break higher and has now begun to decline again.
Experts attribute the resumption of the correction to comments by the President of the Federal Reserve Bank of New York, John Williams. The official noted that it is currently premature to discuss the timing of the start of interest rate cuts; moreover, economic data are so volatile that a new tightening of monetary policy cannot be ruled out now. However, the current negative dynamics are seen as short-term, as investors still remain confident in the US Federal Reserve's transition to "dovish" rhetoric in the medium term, and also hope for the launch of the first spot Bitcoin ETFs in January. According to Bloomberg, negotiations between officials of the US Securities and Exchange Commission (SEC) and representatives of BlackRock Inc., Grayscale Investments, Franklin Templeton and Fidelity Investments are ongoing. At the same time, BlackRock Inc., which may launch a new cryptocurrency product first, last week again adjusted its application in accordance with the requirements of the regulator, which is considered a sign of its imminent approval.
Support and resistance
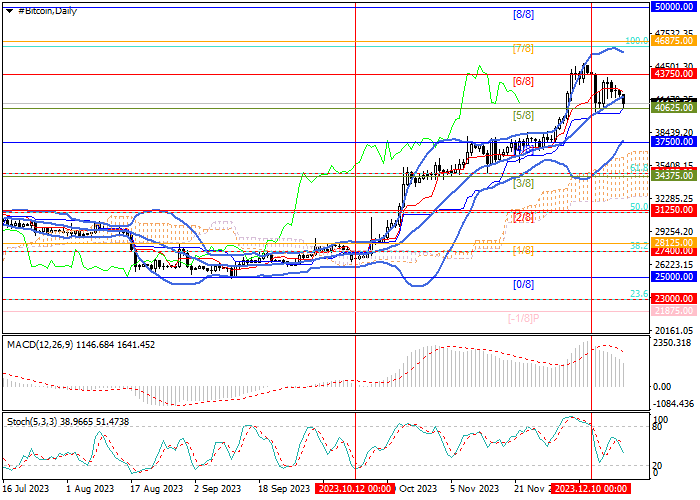
The price is trying to break below the center line of Bollinger Bands and the level of 40625.00 (Murrey level [5/8]) and if successful, the decline may continue to the level of 37500.00 (Murrey level [4/8], the lower line of Bollinger Bands). The level of 43750.00 (Murrey level [6/8]) seems to be key for the "bulls", and its breakout will lead to continued growth towards the targets 46875.00 (Murrey level [7/8]) and 50000.00 (Murrey level [8/8]).
Technical indicators don't provide a clear signal: Bollinger Bands are directed upwards, which confirms the continuation of the upward trend in the market; however, MACD is decreasing in the positive zone, and Stochastic has reversed downwards.
Resistance levels: 43750.00, 46875.00, 50000.00.
Support levels: 40625.00, 37500.00.

Trading tips
Long positions can be opened above 43750.00 or when the price reverses at 37500.00 with targets at 46875.00, 50000.00 and stop-losses at 41600.00 and 35600.00, respectively. Implementation period: 5-7 days.


Hot
No comment on record. Start new comment.