Current trend
The XAU/USD pair is showing a moderate decline, building on the "bearish" momentum of last Friday, as well as testing the psychological level of 2000.00 for a breakdown. Pressure on quotes comes from the November report on the American labor market published at the end of last week, which significantly reduced the likelihood of a faster-than-expected return by the US Federal Reserve to its policy of lowering interest rates.
The Unemployment Rate decreased from 3.9% to 3.7%, which turned out to be lower than expectations at 3.9%, and Average Hourly Earnings accelerated from 0.2% to 0.4% in monthly terms, and remained unchanged in annual terms at the previous level of 4.0%. In addition, the national economy created 199.0 thousand new jobs, which was 19.0 thousand higher than the expected value, while in October the increase was 150.0 thousand. The report led to a revision of forecasts for the timing of the launch of the monetary easing program: if previously experts estimated the probability of the first reduction in borrowing costs in March at 60.0%, now it is no more than 50.0%.
The next meeting of the American regulator will take place on Wednesday, December 13, when updated forecasts for interest rates for the next 3 years will be published. The week will also see meetings of the Swiss National Bank, the Bank of England and the European Central Bank (ECB). At the moment, analysts do not expect any changes in the vector of monetary policy of all these regulators.
There is a downward correction in the gold contract market. According to a report from the US Commodity Futures Trading Commission (CFTC), last week the number of net speculative positions increased to 203.5 thousand from 200.1 thousand the week before. There is a continuing fixation of long positions: the balance of swap dealers is 72.632 thousand for the "bulls" versus 260.912 thousand for the "bears". Last week, buyers reduced the number of contracts by 0.299 thousand, while sellers increased it by 6.065 thousand, indicating growing market confidence in the completion of the current upward trend and fixation of positions.
Support and resistance
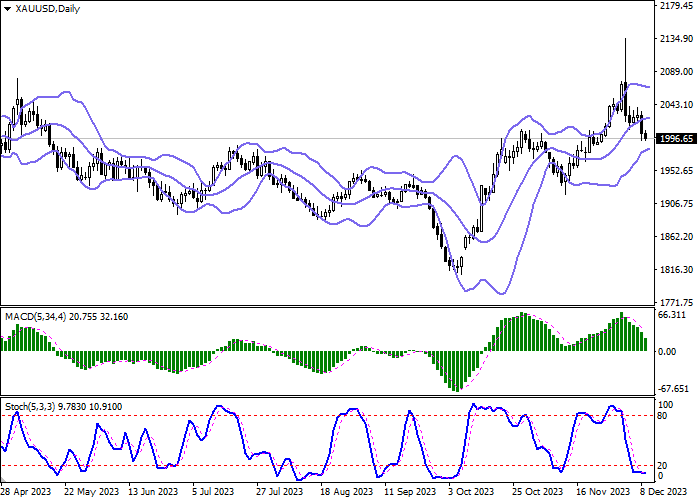
In the D1 chart, Bollinger Bands are reversing horizontally. The price range is narrowing, reflecting ambiguous dynamics of trading in the short term. MACD is going down preserving a stable sell signal (located below the signal line). Stochastic, having reached its lows, reversed into the horizontal plane, indicating risks of the oversold gold in the ultra-short term.
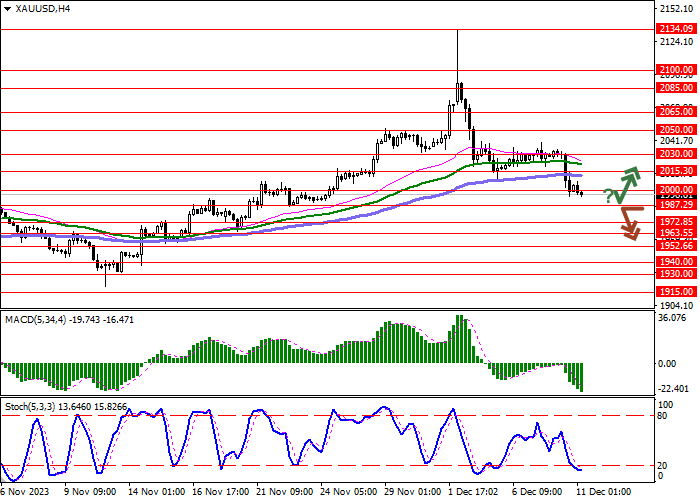
Resistance levels: 2015.30, 2030.00, 2050.00, 2065.00.
Support levels: 2000.00, 1987.29, 1972.85, 1963.55.

Trading tips
Short positions may be opened after a breakdown of 1987.29 with the target at 1963.55. Stop-loss — 2000.00. Implementation time: 1-2 days.
A rebound from 1987.29 as from support followed by a breakout of 2000.00 may become a signal for opening new long positions with the target at 2030.00. Stop-loss — 1985.00.


Hot
No comment on record. Start new comment.