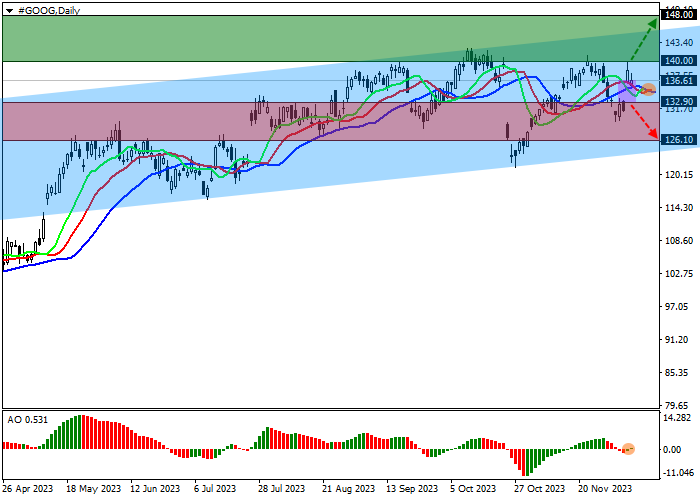
Shares of the American holding Alphabet Inc. are moving in a corrective trend, trading at 137.00.
An ascending channel with dynamic boundaries of 124.00–147.00 is forming on the daily chart, within which the price is heading toward the resistance line.
On the four-hour chart, the quotes reached the last local high of 140.00 and may continue to grow, as confirmed by the upward price gap of 133.00–136.60 formed last week.
Technical indicators do not provide a clear signal but have indicated an upward reversal: fast EMAs on the Alligator indicator have crossed the signal line upward, and the AO histogram is forming upward bars above the transition level.
Trading tips
Long positions may be opened after the price rises and consolidates above 140.00 with the target at 148.00. Stop loss – 137.00. Implementation period: 7 days or more.
Short positions may be opened after the price declines and consolidates below 132.90 with the target at 126.10. Stop loss – 135.00.
Disclaimer: The content above represents only the views of the author or guest. It does not represent any views or positions of FOLLOWME and does not mean that FOLLOWME agrees with its statement or description, nor does it constitute any investment advice. For all actions taken by visitors based on information provided by the FOLLOWME community, the community does not assume any form of liability unless otherwise expressly promised in writing.


Hot
No comment on record. Start new comment.