Current trend
Last week, the BTC/USD pair gained in value within the medium-term trend amid market participants' hopes for the early approval by the U.S. Securities and Exchange Commission (SEC) of the launch of the first spot bitcoin ETF.
Demand for the world's first cryptocurrency increased amid reports of consultations between officials and management of Grayscale Investments regarding the potential transformation of the GBTC trust into a cryptocurrency investment product and discussion of the final issues of asset storage, position creation, and risk disclosure for investors. Nevertheless, after reaching annual highs above 44700.00, the price began a downward correction and today reached the central line of Bollinger Bands around 40350.00.
Experts note that the current decline could be caused by two factors – partial profit-taking by investors after prolonged growth and disappointment after the publication of November data on the US labor market last Friday. Recall that employment growth amounted to 199.0 thousand, significantly exceeding forecasts of 180.0 thousand, while unemployment decreased from 3.9% to 3.7%. The US labor market has demonstrated resilience to the current monetary policy tightening measures of the US Federal Reserve, allowing the authorities to keep the interest rate at a high level for a longer period than expected.
Despite the current correction, investors still hope that the launch of a BTC-based ETF will attract major players to the sector, which, in turn, will act as a catalyst for the upward dynamics of the trading instrument in the near future.
Support and resistance
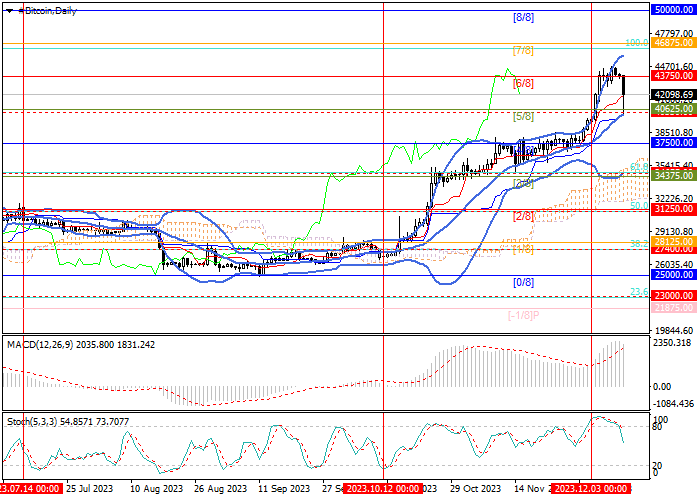
Technically, the price remains close to the central line of Bollinger Bands near 40350.00, the breakdown of which may cause the quotes to decline to 37500.00 (Murrey level [4/8]) and 34375.00 (Murrey level [3/8], 61.8% Fibonacci retracement). The key for the "bulls" remains the 43750.00 mark (Murrey level [6/8]), a retest of which will cause an increase to 46875.00 (Murrey level [7/8]) and 50000.00 (Murrey level [8/8]).
Technical indicators don't provide a clear signal: Bollinger Bands are directed upward, and MACD is stable in the positive zone, confirming the continuation of the uptrend, but Stochastic has left the overbought zone, not excluding the development of a correction.
Resistance levels: 43750.00, 46875.00, 50000.00.
Support levels: 40350.00, 37500.00, 34375.00.

Trading tips
Long positions can be opened above the 43750.00 mark with targets at 46875.00, 50000.00 and stop-loss around 41800.00. Implementation period: 5–7 days.
Short positions can be opened below the level of 40350.00 with targets at 37500.00, 34375.00 and stop-loss near 42500.00.


Hot
No comment on record. Start new comment.