Current trend
This week, shares of RTX Corp., an American aerospace and defense conglomerate, resumed growth as part of a correction to a long-term downtrend.
Pressure on the quotes is exerted by the development of the situation with Pratt & Whitney aircraft engines for Airbus A320neo, most of which require examination for microscopic cracks and, in case of technical malfunctions, recall from production, which will entail major financial losses for RTX Corp. Despite these reports, investors positively assess the medium-term prospects of the emitter, primarily against the background of global geopolitical tensions. The continuation of the Ukrainian armed conflict, as well as the aggravation of the situation in the Middle East, will certainly increase the number of military orders that will be able to offset the losses of RTX Corp. aviation units.
Currently, experts are awaiting the publication of the company's financial statements for Q4 2023: earnings per share (EPS) may amount to 1.25 dollars, which is 1.57% less than a year earlier, but sales are likely to reach 19.75 billion dollars, adding 9.15%. As for the overall indicators for 2023, EPS may be fixed at 5.0 dollars, and revenue — 74.1 billion dollars, exceeding last year's values by 4.6% and 10.5%, respectively.
Support and resistance
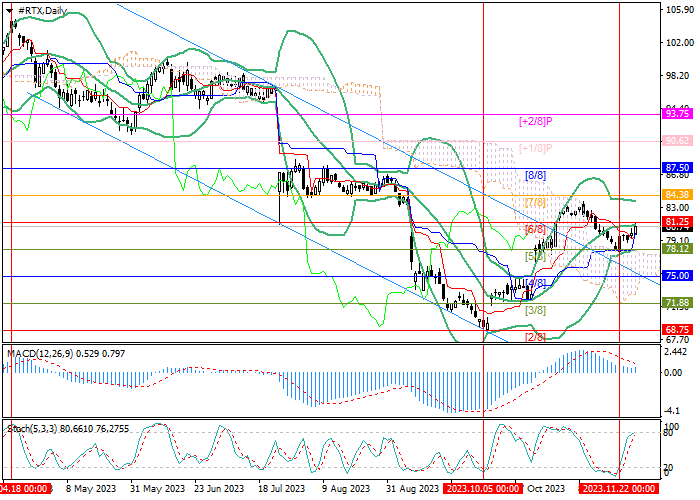
Technically, the price is testing the 81.25 mark (Murrey level [6/8]), supported by the central line of Bollinger Bands, overcoming which will allow the upward dynamics to continue with the target at 84.38 (Murrey level [7/8]) and 97.50 (Murrey level [8/8]). The key for the "bears" is the level of 75.00 (Murrey level [4/8]), the breakdown of which will ensure the return of quotes to the descending channel and a decline to 68.75 (Murrey level [2/8]).
Technical indicators do not give a clear signal: Bollinger Bands are horizontal, MACD histogram is stable in the positive zone, and Stochastic is directed upwards.
Resistance levels: 81.25, 84.38, 97.50.
Support levels: 75.00, 68.75.

Trading tips
Long positions can be opened above the 81.25 mark with targets at 84.38, 97.50 and stop-loss at 79.20. Implementation period: 5–7 days.
Short positions should be opened below the level of 75.00 with the target at 68.75 and stop-loss at 77.00.


Hot
No comment on record. Start new comment.