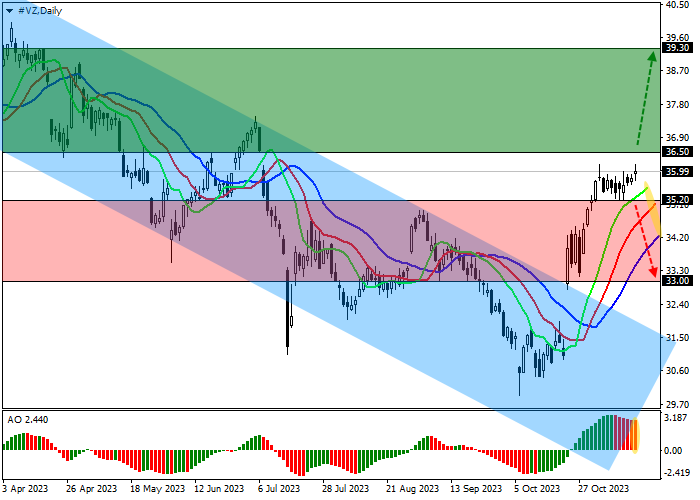
Saham Verizon Communications Inc., salah satu perusahaan telekomunikasi terbesar AS, diperdagangkan pada 36.00.
Pada grafik harian, harga bergerak dalam tren korektif, meninggalkan batas koridor bawah dengan batas dinamis 34.00–30.00.
Pada grafik empat jam, setelah berkonsolidasi di atas harga tertinggi 31 Agustus di sekitar 35.00, harga berkonsolidasi bersiap untuk melampaui harga tertinggi lokal di 36.10, setelah itu tidak akan ada lagi hambatan yang tersisa menuju harga tertinggi tahunan di 39.50.
Indikator teknis memperkuat sinyal buy: fast EMA pada indikator Alligator bergerak menjauh dari garis sinyal, dan histogram AO membentuk bar menaik.
Tips perdagangan
Posisi buy dapat dibuka setelah harga naik dan berkonsolidasi di atas 36.50 dengan target di 39.30. Stop loss di 35.50. Periode implementasi: 7 hari atau lebih.
Posisi sell dapat dibuka setelah harga turun dan berkonsolidasi di bawah 35.20 dengan target di 33.00. Stop loss di 36.00.
Disclaimer: The content above represents only the views of the author or guest. It does not represent any views or positions of FOLLOWME and does not mean that FOLLOWME agrees with its statement or description, nor does it constitute any investment advice. For all actions taken by visitors based on information provided by the FOLLOWME community, the community does not assume any form of liability unless otherwise expressly promised in writing.


Hot
No comment on record. Start new comment.