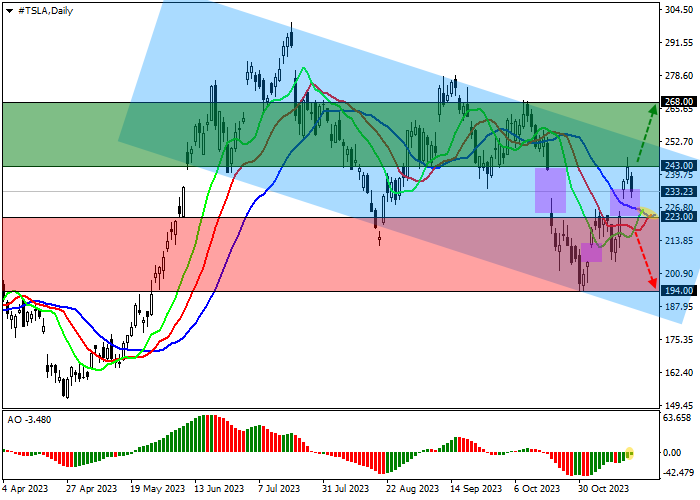
Saham Tesla Inc., produsen mobil listrik terkemuka di dunia, diperdagangkan pada 233.00.
Pada grafik harian, harga terkoreksi ke atas dalam channel turun dengan batas 252.00–190.00.
Pada grafik empat jam, pergerakan disertai dengan kesenjangan harga: yang terakhir adalah antara 233.00 dan 224.00, dan penyelesaiannya mungkin akan segera selesai, setelah itu harga akan terus naik ke level resistance channel di 254.00.
Indikator teknis memberikan sinyal sell: fast EMA pada indikator Alligator melintasi garis sinyal ke atas, dan histogram AO mendekati transisi ke zona buy.
Tips perdagangan
Posisi buy dapat dibuka setelah harga naik dan berkonsolidasi di atas 243.00 dengan target di 268.00. Stop loss di 238.00. Periode implementasi: 7 hari atau lebih.
Posisi sell dapat dibuka setelah harga turun dan berkonsolidasi di bawah 223.00 dengan target di 194.00. Stop loss di 230.00.
Disclaimer: The content above represents only the views of the author or guest. It does not represent any views or positions of FOLLOWME and does not mean that FOLLOWME agrees with its statement or description, nor does it constitute any investment advice. For all actions taken by visitors based on information provided by the FOLLOWME community, the community does not assume any form of liability unless otherwise expressly promised in writing.


Hot
No comment on record. Start new comment.