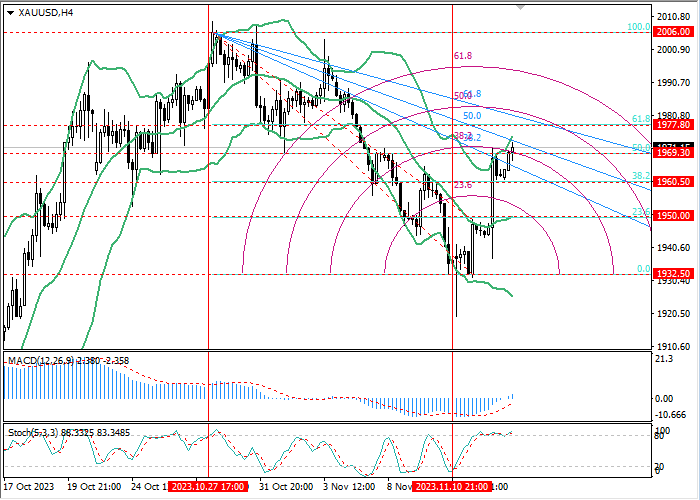
XAU/USD, H4
On the H4 chart, the price is rising, turning around 1932.50 (0.0% retracement): currently, quotes are trying to consolidate above the 1969.30 mark (50.0% retracement) in order to continue moving to the levels of 1978.00 (61.8% retracement) and 2006.00 (100.0% retracement). After a breakdown of the 1961.00 mark (38.2% retracement), the decline will resume to the level of 1950.00 (23.6% retracement, the central line of Bollinger Bands).
Technical indicators confirm further growth: Bollinger Bands and Stochastic are reversing up, MACD is increasing in the positive zone.
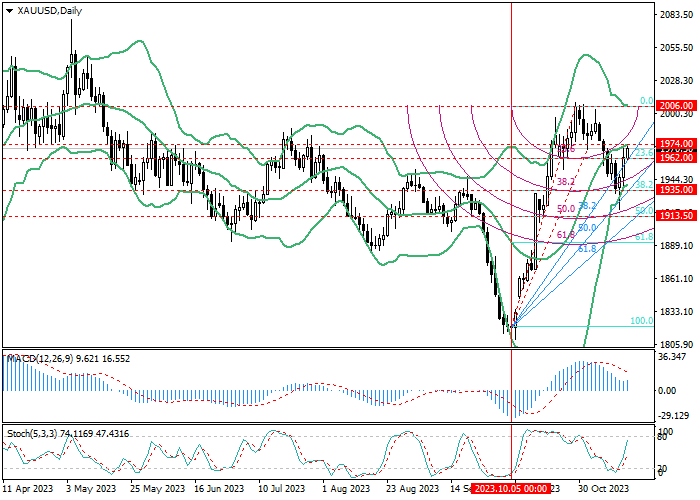
XAU/USD, D1
On the D1 chart, the instrument is strengthening within the uptrend and is currently testing the central line of Bollinger Bands around 1974.00, consolidating above which will allow quotes to grow up to the level of 2006.00 (0.0% retracement). After a breakdown of the 1962.00 mark (23.6% retracement), the decline will continue to the level of 1935.00 (38.2% retracement).
Technical indicators confirm further growth: Bollinger Bands and Stochastic are reversing up, MACD has stabilized in the positive zone.
Support and resistance
In the near future, the upward dynamics of the instrument seems to be a more likely scenario. If the price consolidates above the 1969.30 mark (50.0% retracement, H4), the growth will continue to the levels of 1978.00 (61.8% retracement, H4) and 2006.00 (100.0% retracement, H4, and 0.0% retracement, D1). If the level of 1961.00 (38.2% retracement, H4) is broken down, the decline may continue to 1950.00 (23.6% retracement, H4) and 1935.00 (38.2% retracement, D1).
Resistance levels: 1969.30, 1978.00, 2006.00.
Support levels: 1961.00, 1950.00, 1935.00.
Trading tips
Long positions may be opened from the current level with targets at 1978.00, 2006.00 and stop-loss at 1966.50. Implementation period: 5–7 days.
Short positions may be opened below the level of 1961.00 with targets at 1950.00, 1935.00 and stop-loss at 1968.00.


Hot
No comment on record. Start new comment.