Saham Alibaba Group Holdings Ltd., salah satu perusahaan e-commerce terbesar di dunia, terkoreksi di 87.00.
Pada grafik harian, harga meninggalkan koridor turun lokal dengan batas dinamis 85.00–79.00.
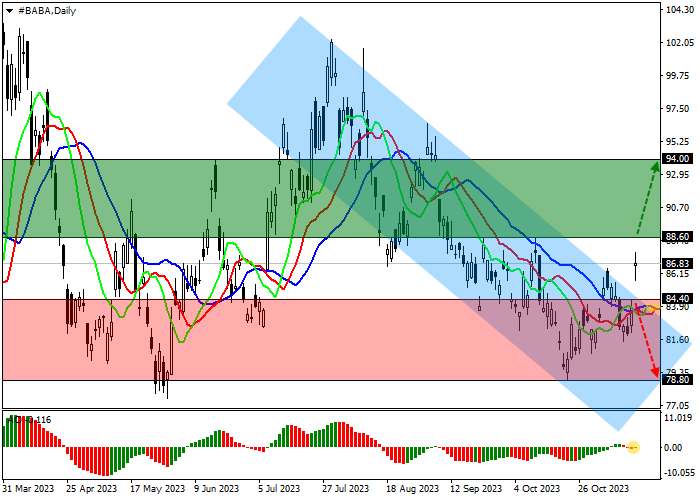
Pada grafik empat jam, potensi pertumbuhan lebih lanjut meningkat signifikan terhadap terbentuknya gap harga di 86.70–83.74. Resistance terdekat adalah titik tertinggi lokal di 88.00, konsolidasi di atasnya akan memungkinkan harga untuk melanjutkan tren kenaikannya.
Indikator teknis memberikan sinyal beli: fast EMA pada indikator Alligator menembus garis sinyal ke atas, dan histogram AO membentuk batang menaik, bergerak ke zona beli.
Tips perdagangan
Posisi buy dapat dibuka setelah harga naik dan berkonsolidasi di atas 88.60 dengan target di 94.00. Stop loss – 86.00. Periode implementasi: 7 hari atau lebih.
Posisi sell dapat dibuka setelah harga turun dan berkonsolidasi di bawah 84.40 dengan target di 78.80. Stop loss – 86.00.
Disclaimer: The content above represents only the views of the author or guest. It does not represent any views or positions of FOLLOWME and does not mean that FOLLOWME agrees with its statement or description, nor does it constitute any investment advice. For all actions taken by visitors based on information provided by the FOLLOWME community, the community does not assume any form of liability unless otherwise expressly promised in writing.


Hot
No comment on record. Start new comment.