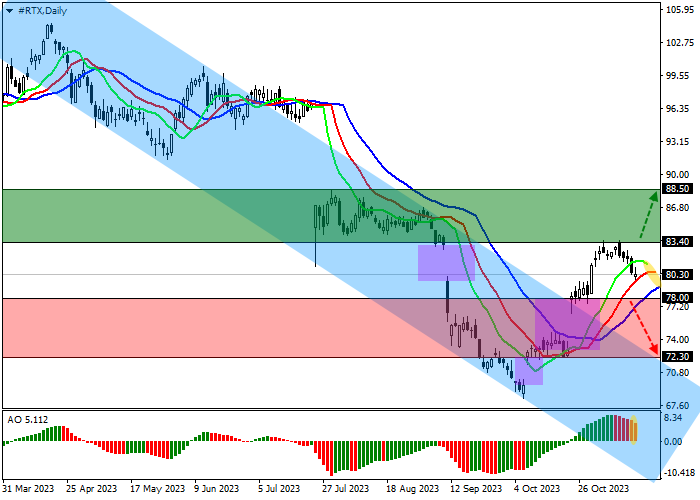
Saham RTX Corp., konglomerat kedirgantaraan dan pertahanan Amerika, bergerak dalam tren korektif mendekati 80.00.
Pada grafik harian, koreksi ke atas lokal terus berlanjut, dan harga tetap berada di atas garis resistance channel turun yang lebar di 78.00–68.00.
Pada grafik empat jam, harga meninggalkan channel, membentuk gap harga di 78.00–73.00, dan tidak mencoba menyelesaikannya, mencerminkan potensi tinggi pergerakan ke atas yang mungkin berlanjut setelah aset berkonsolidasi di atas harga lokal tertinggi 83.00.
Indikator teknis menahan sinyal beli: fast EMA pada indikator Alligator cukup jauh dari garis sinyal, dan histogram AO membentuk batang ke bawah di zona beli.\
Tips perdagangan
Posisi buy dapat dibuka jika harga naik dan berkonsolidasi di atas 83.40 dengan target di 88.50. Stop loss – 81.00. Periode implementasi: 7 hari atau lebih.
Posisi sell dapat dibuka setelah harga turun dan berkonsolidasi di bawah 78.00 dengan target di 72.30. Stop loss – 80.00.
Disclaimer: The content above represents only the views of the author or guest. It does not represent any views or positions of FOLLOWME and does not mean that FOLLOWME agrees with its statement or description, nor does it constitute any investment advice. For all actions taken by visitors based on information provided by the FOLLOWME community, the community does not assume any form of liability unless otherwise expressly promised in writing.


Hot
No comment on record. Start new comment.