USD/CHF, D1
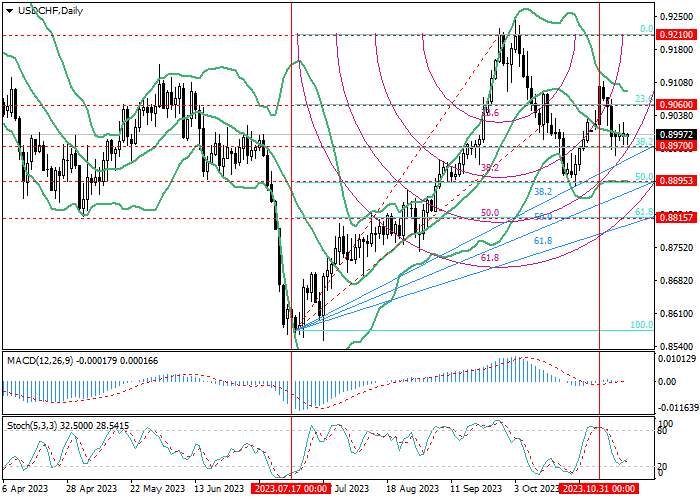
On the D1 chart, the USD/CHF pair has resumed its decline since the beginning of this month and is now close to 0.8970 (38.2% Fibonacci retracement), the breakdown of which will allow the negative dynamics to continue to the levels of 0.8895 (50.0% Fibonacci retracement) and 0.8815 (61.8% Fibonacci retracement). While doing so, the price will have to break through the ascending "fan". If the quotes are re-consolidated above the 0.9060 mark (23.6% Fibonacci retracement), the quotes may return to the area of 0.9210 (0.0% Fibonacci retracement).
Technical indicators do not give a clear signal: Bollinger Bands are reversing horizontally after the decline, MACD is at the zero line and its volumes are insignificant, while Stochastic is reversing up from the oversold zone.
USD/CHF, W1
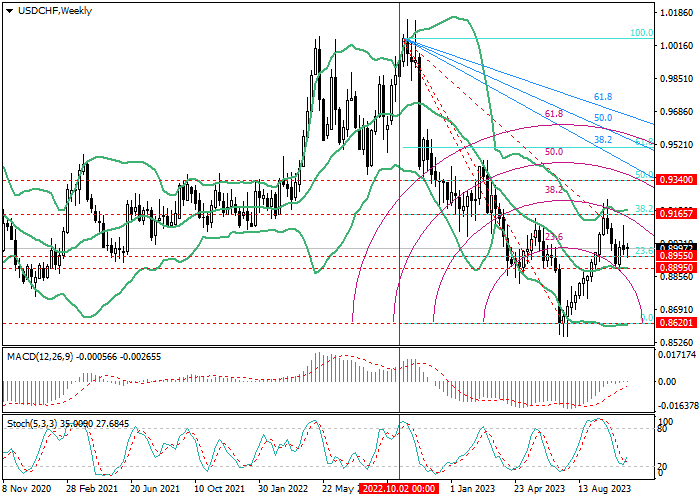
On the W1 chart, the price reversed down from 0.9165 (38.2% Fibonacci retracement) and is now close to the 0.8955–0.8895 support zone (23.6% Fibonacci retracement, the central line of Bollinger Bands), the breakdown of which will allow the decline to continue to the level of 0.8620 (0.0% Fibonacci retracement).
Technical indicators do not give a clear signal: Bollinger Bands are reversing horizontally after the decline, MACD is at the zero line and its volumes are insignificant. Stochastic is reversing up from the oversold zone.
Support and resistance
In the near future, the resumption of the quotes growth is not excluded. If the level of 0.9060 (23.6% Fibonacci retracement , D1) is broken out, its targets may be 0.9165 (38.2% Fibonacci retracement, W1), 0.9210 (0.0% Fibonacci retracement, D1) and 0.9340 (50.0% Fibonacci retracement, W1). After the breakdown of the level of 0.8970 (38.2% Fibonacci retracement, D1), the decline will be able to continue to 0.8895 (50.0% Fibonacci retracement, D1, the central line of Bollinger Bands, W1) and 0.8815 (61.8% Fibonacci retracement).
Resistance levels: 0.9060, 0.91 65, 0.9210, 0.93 40.
Support levels: 0.8970, 0.8895, 0.8815.
Trading tips
Long positions can be opened above the 0.9060 mark with targets at 0.9165, 0.9210, 0.9340 and stop-loss at 0.9000. Implementation period: 5-7 days.
Short positions can be opened below 0.8970 with targets at 0.8895, 0.8815 and stop-loss at 0.9020.


Hot
No comment on record. Start new comment.