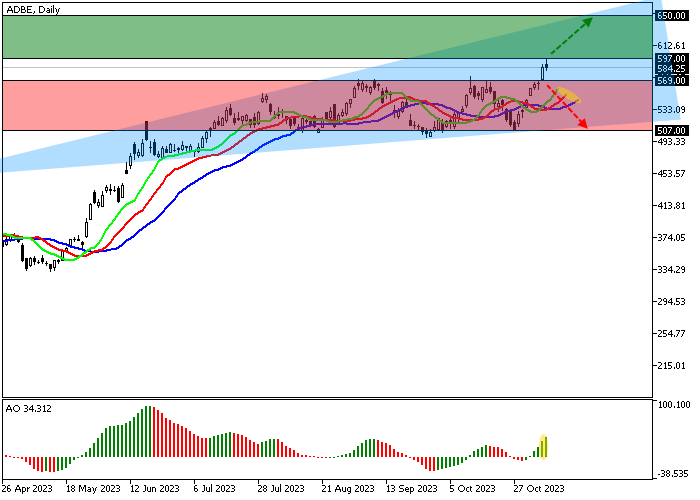
Shares of Adobe Inc., a leading American software developer, are trading within a corrective trend at 585.00.
On the daily chart, the price is growing within the global Expanding formation pattern with dynamic boundaries of 660.00–510.00.
On the four-hour chart, the likelihood of continued upward dynamics is confirmed by the consolidation above the year’s high of 569.00, and now, when there is practically no resistance left for further movement, the asset can reach the pattern resistance level of 660.00.
Technical indicators gave a buy signal: the EMA fluctuation range on the Alligator indicator expands upwards, and the AO histogram forms ascending bars in the buy zone.
Trading tips
Long positions may be opened after the price rises and consolidates above 597.00 with the target at 650.00. Stop loss – 580.00. Implementation period: 7 days or more.
Short positions may be opened after the price declines and consolidates below 569.00 with the target at 507.00. Stop loss – 600.00.
Disclaimer: The content above represents only the views of the author or guest. It does not represent any views or positions of FOLLOWME and does not mean that FOLLOWME agrees with its statement or description, nor does it constitute any investment advice. For all actions taken by visitors based on information provided by the FOLLOWME community, the community does not assume any form of liability unless otherwise expressly promised in writing.


Hot
No comment on record. Start new comment.