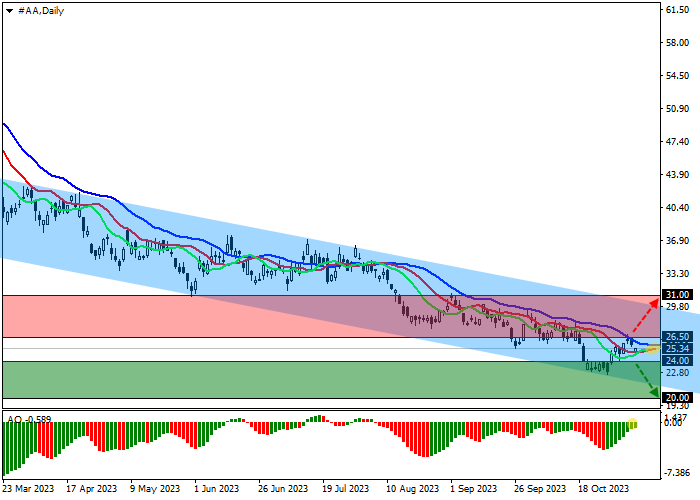
Saham Alcoa Corp., salah satu produsen aluminium terbesar dunia, terkoreksi pada 25.00.
Pada grafik harian, harga menurun sebagai bagian dari tren penurunan global dengan batas dinamis pada 22.00–30.00.
Pada grafik empat jam, kendala utama adalah level support 24.00 di dalam channel, konsolidasi di bawahnya akan memungkinkan harga mencapai 20.00. Jika aset berkonsolidasi di atas harga tertinggi lokal di 26.50, dinamika positif dapat berlanjut ke level resistance channel di 30.00.
Indikator teknis mempertahankan sinyal jual yang stabil: kisaran fluktuasi EMA pada indikator Alligator mengarah ke bawah, dan histogram AO membentuk batang korektif di zona jual.
Tips perdagangan
Posisi sell dapat dibuka setelah harga turun dan berkonsolidasi di bawah level 24.00 dengan target pada 20.00. Stop loss – 26.00. Periode implementasi: 7 hari atau lebih.
Posisi buy dapat dibuka setelah harga naik dan berkonsolidasi di atas 26.50 dengan target di 31.00. Stop loss – 25.00.
Disclaimer: The content above represents only the views of the author or guest. It does not represent any views or positions of FOLLOWME and does not mean that FOLLOWME agrees with its statement or description, nor does it constitute any investment advice. For all actions taken by visitors based on information provided by the FOLLOWME community, the community does not assume any form of liability unless otherwise expressly promised in writing.


Hot
No comment on record. Start new comment.