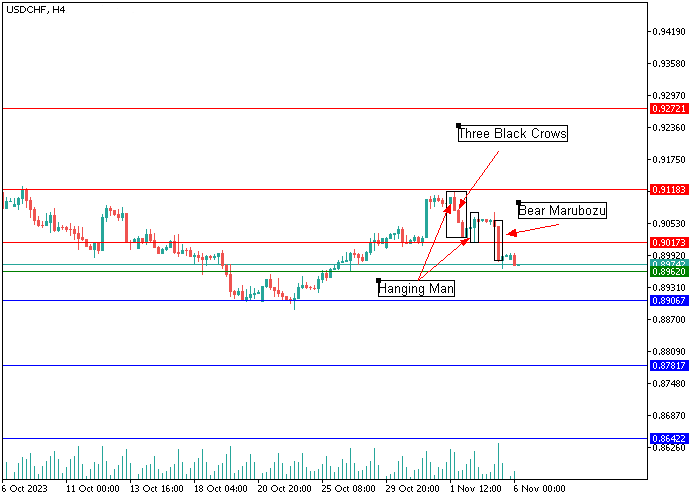
USD/CHF, H4
On the four-hour chart in the range of 0.9118–0.9017, the formation of Hanging Man candlestick analysis reversal patterns is observed, signaling that the quotes of the USD/CHF pair have reached a local top, as well as the construction of Three Black Crows and Marubozu "bearish" patterns, which emphasize the activation of sellers from the local sales zone in the area of 0.9118–0.9017. In the current situation, it is likely that the negative dynamics will continue towards the support level of 0.8906, overcoming which could become a catalyst for opening short positions with targets in the range of 0.8781–0.8642. An alternative scenario is possible in the event of a reversal and consolidation of the price above the level of 0.9017. Then the "bulls" will have the opportunity to restore previously lost positions in the area of 0.9118–0.9272.
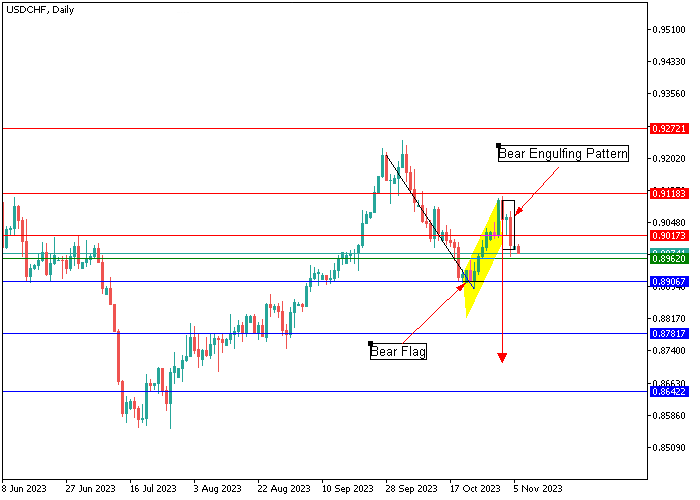
USD/CHF, D1
The daily chart shows the construction of a large Bearish Flag price pattern with a target of 0.8787, the breakdown of the lower border of which occurred near the resistance level of 0.9017. The formation of the Bearish Engulfing candlestick pattern confirmed the continuation of negative dynamics for the instrument, which is likely to continue moving to the level of 0.8906, and then to the area of 0.8781–0.8642.
Support and resistance
Support levels: 0.8906, 0.8781, 0.8642.
Resistance levels: 0.9017, 0.9118, 0.9272.
Trading tips
Short positions can be opened below the level of 0.8906 with targets at 0.8781, 0.8642. Stop-loss — 0.8962. Implementation time: 9-12 days.
Long positions can be opened above 0.9017 with targets at 0.9118, 0.9272. Stop-loss — 0.8962.


Hot
No comment on record. Start new comment.