Current trend
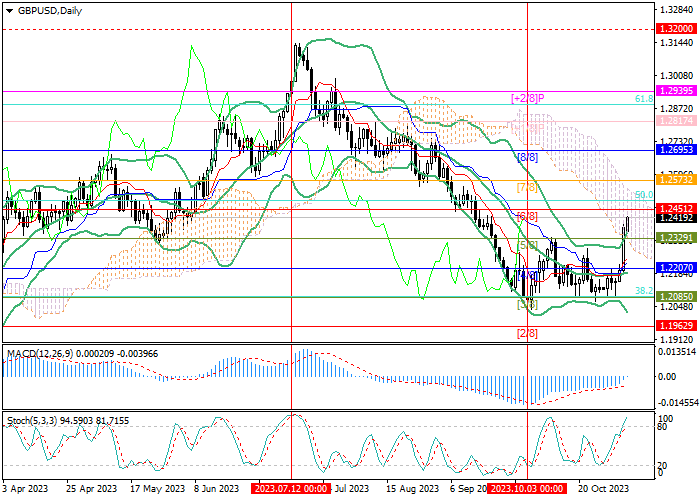
The GBP/USD pair has been correcting upwards for the second month against the medium-term downward trend: the price is close to 1.2451 (Murrey level [6/8]), a breakout of which will give the prospect of continued growth to the area of 1.2573 (Murrey level [7/8]) and 1.2695 (Murrey level [8/8]). The key “bearish” level is 1.2207 (Murrey level [4/8]), supported by the middle line of Bollinger bands, if consolidated below which the downward dynamics can resume around 1.2085 (Murrey level [3/8], Fibonacci correction 38.2%) and 1.1962 (Murrey level [2/8]).
Technical indicators reflect the likelihood of further growth: Bollinger Bands and Stochastic reverse upwards, the MACD histogram is preparing to move into the positive zone and form a buy signal. The price chart going beyond the upper Bollinger band does not exclude a downward correction but is unlikely to lead to a change in the current trend.
Support and resistance
Resistance levels: 1.2451, 1.2573, 1.2695.
Support levels: 1.2207, 1.2085, 1.1962.
Trading tips
Long positions may be opened above 1.2451 with the targets at 1.2573, 1.2695 and stop loss around 1.2370. Implementation time: 5–7 days.
Short positions may be opened below 1.2207 with the targets at 1.2085, 1.1962 and stop loss around 1.2290.


Hot
No comment on record. Start new comment.