NZD/USD: HIGH POTENTIAL FOR STRENGTHENING DOWNWARD DYNAMICS


| Scenario | |
|---|---|
| Timeframe | Weekly |
| Recommendation | SELL STOP |
| Entry Point | 0.5830 |
| Take Profit | 0.5737, 0.5615 |
| Stop Loss | 0.5890 |
| Key Levels | 0.5615, 0.5737, 0.5798, 0.5920, 0.6042, 0.6103 |
| Alternative scenario | |
|---|---|
| Recommendation | BUY STOP |
| Entry Point | 0.5920 |
| Take Profit | 0.6042, 0.6103 |
| Stop Loss | 0.5875 |
| Key Levels | 0.5615, 0.5737, 0.5798, 0.5920, 0.6042, 0.6103 |
Current trend
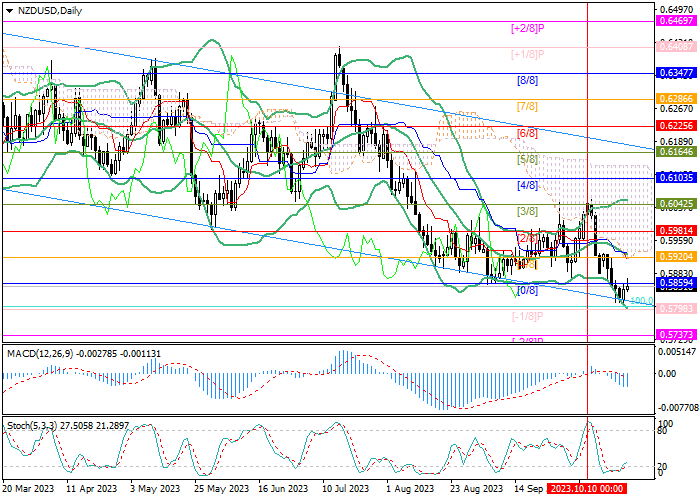
The NZD/USD pair is moving within a long-term downward channel but it started the current week with growth, turning around the lower border of the range, and is currently testing the level of 0.5859 (Murrey level [0/8]).
The American dollar is under pressure ahead of the publication of preliminary October business activity data: manufacturing PMI is expected to decline from 49.8 points to 49.5 points, and services PMI – from 50.1 points to 49.8 points, entering a zone of stagnation, which could create additional problems for the national economy and contribute to a deepening of its decline. However, it is consistent with the goals of the US Federal Reserve, as the regulator seeks to reduce inflationary pressure, and the implementation of forecasts will increase the likelihood of the officials refusing to tighten monetary policy further, acting as a catalyst for the weakening of the dollar.
The growth potential of the New Zealand currency also looks limited against poor macroeconomic statistics: Q3 inflation was 5.6%, significantly above the target level, and the September volume of foreign trade continued its negative trend.
Support and resistance
The trading instrument reversed at the lower border of the downward channel but for a full correction to develop, it needs to consolidate above 0.5920 (Murrey level [1/8], the middle line of Bollinger Bands), after which growth is possible to the area of 0.6042 (Murrey level [3/8] ) and 0.6103 (Murrey level [4/8]), otherwise, the negative dynamics will resume along the lower border of the channel with the targets of 0.5737 (Murrey level [–2/8]), 0.5615.
Technical indicators confirm the likelihood of a decline: Bollinger bands are directed downwards, the MACD histogram is increasing in the negative zone, and Stochastic has left the oversold zone.
Resistance levels: 0.5920, 0.6042, 0.6103.
Support levels: 0.5798, 0.5737, 0.5615.
Trading tips
Short positions may be opened from 0.5830 with the targets at 0.5737, 0.5615, and stop loss around 0.5890. Implementation time: 5–7 days.
Long positions may be opened above 0.5920 with the targets at 0.6042, 0.6103 and stop loss around 0.5875.
Disclaimer: The content above represents only the views of the author or guest. It does not represent any views or positions of FOLLOWME and does not mean that FOLLOWME agrees with its statement or description, nor does it constitute any investment advice. For all actions taken by visitors based on information provided by the FOLLOWME community, the community does not assume any form of liability unless otherwise expressly promised in writing.
FOLLOWME Trading Community Website: https://www.followme.com


Hot
No comment on record. Start new comment.