DAX 40: DYNAMICS IN THE BOND MARKET PUTS PRESSURE ON INDEX POSITIONS

| Scenario | |
|---|---|
| Timeframe | Weekly |
| Recommendation | SELL STOP |
| Entry Point | 14600.0 |
| Take Profit | 14200.0 |
| Stop Loss | 14800.0 |
| Key Levels | 14200.0, 14600.0, 14940.0, 15400.0 |
| Alternative scenario | |
|---|---|
| Recommendation | BUY STOP |
| Entry Point | 14940.0 |
| Take Profit | 15400.0 |
| Stop Loss | 14600.0 |
| Key Levels | 14200.0, 14600.0, 14940.0, 15400.0 |
Current trend
The leading index of the Frankfurt Stock Exchange DAX 40 corrected at around 14785.0.
Late last week, oilfield services company Schlumberger NV released its financial results, reporting revenue of 7.85 billion euros, beating the forecast of 7.81 billion euros, while its earnings per share amounted to 0.7366 euros, also exceeding expectations at 0.7229 euros. In turn, international pharmaceutical and laboratory equipment supplier Sartorius AG recorded revenue of 810.7 million euros, well short of the 851.45 million euros that analysts had expected, and earnings per share of 0.13 euros were lower than 1.34 euros forecast and 1.39 euros shown a quarter earlier.
The upward dynamics in the bond market continues to act as a catalyst for the outflow of investor funds from the stock market. The day before, auctions were held to place one-year German Bubill securities, the income rate for which was 3.729% after 3.691% at the previous placement. In turn, 10-year bonds are trading at a yield of 2.8605%, which is significantly higher than the 2.7370% recorded at the beginning of last week.
The growth leaders in the index are Covestro AG ( 2.53%), Zalando SE ( 2.37%), HeidelbergCement AG ( 2.24%), Siemens Healthineers AG ( 2.11%).
Among the leaders of the decline are Merck KGaA (-2.65%), Sartorius AG (-2.42%), Siemens Energy AG (-1.70%).
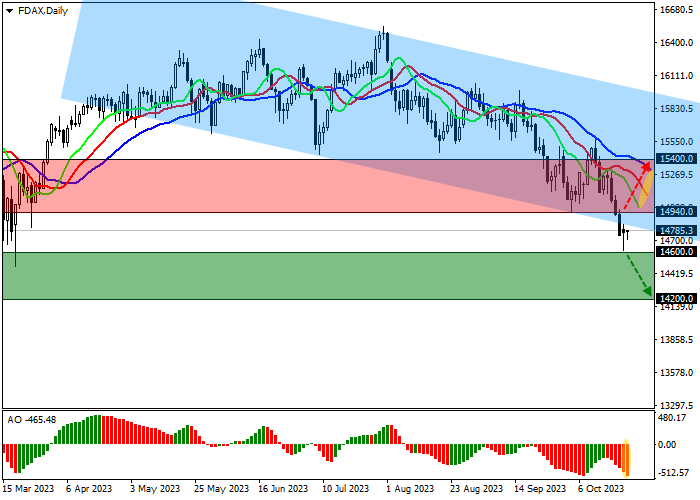
Support and resistance
On the daily chart, the price is trading in a corrective trend, having again left the boundaries of the downward channel 16000.0–14700.0 and broken the support line.
Technical indicators are in a stable sell signal state: fast EMAs on the Alligator indicator continue to be at a stable distance from the signal line, and the AO histogram, being in the sell zone, forms correctional bars.
Support levels: 14600.0, 14200.0.
Resistance levels: 14940.0, 15400.0.

Trading tips
If the asset continues declining and the price consolidates below 14600.0, short positions can be opened with the target at 14200.0. Stop-loss — 14800.0. Implementation time: 7 days and more.
If the asset continues growing locally and the price consolidates above the local resistance level of 14940.0, long positions will be relevant with target at 15400.0. Stop-loss — 14600.0.
Disclaimer: The content above represents only the views of the author or guest. It does not represent any views or positions of FOLLOWME and does not mean that FOLLOWME agrees with its statement or description, nor does it constitute any investment advice. For all actions taken by visitors based on information provided by the FOLLOWME community, the community does not assume any form of liability unless otherwise expressly promised in writing.
FOLLOWME Trading Community Website: https://www.followme.com


Hot
No comment on record. Start new comment.