PFIZER INC.: MURREY ANALYSIS


Scenario Timeframe Weekly Recommendation SELL STOP Entry Point 31.20 Take Profit 29.69, 28.12 Stop Loss 32.30 Key Levels 28.12, 29.69, 31.25, 32.81, 34.38, 35.16
Alternative scenario Recommendation BUY STOP Entry Point 32.85 Take Profit 34.38, 35.16 Stop Loss 31.70 Key Levels 28.12, 29.69, 31.25, 32.81, 34.38, 35.16
Current trend
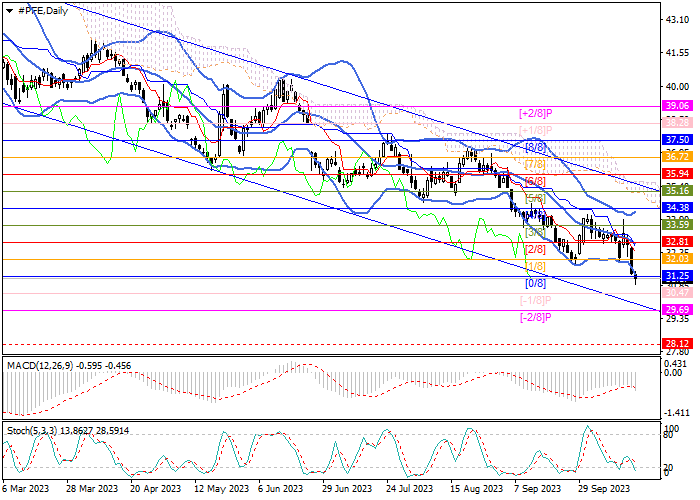
Shares of Pfizer Inc., the largest American pharmaceutical company, continue to trade in a long-term downward channel.
Currently, the price has reached the lower border of the main Murrey trading range at 31.25 (Murrey level [0/8]) and may continue to decline into the reversal zone to the levels of 29.69 (Murrey level [-2/8]) and 28.12 (Murrey level [1/8], W1 chart). The key for the "bulls" is the reversal level of 32.81 (Murrey level [2/8]), supported by the central line of Bollinger Bands. Its breakout will allow the quotes to continue growing to the central mark of the Murrey trading range at 34.38 (Murrey level [4/8]) or to the level of 35.16 (Murrey level [5/8]), but this scenario seems less likely.
Technical indicators point to the continuation of the downtrend: Bollinger Bands and Stochastic are pointing downwards, while MACD is increasing in the negative zone.
Support and resistance
Resistance levels: 32.81, 34.38, 35.16.
Support levels: 31.25, 29.69, 28.12.
Trading tips
Short positions should be opened below the level of 31.25 with targets at 29.69, 28.12 and stop-loss near 32.30. Implementation period: 5-7 days.
Long positions can be opened above the 32.81 mark with targets at 34.38, 35.16 and stop-loss at 31.70.
| Scenario | |
|---|---|
| Timeframe | Weekly |
| Recommendation | SELL STOP |
| Entry Point | 31.20 |
| Take Profit | 29.69, 28.12 |
| Stop Loss | 32.30 |
| Key Levels | 28.12, 29.69, 31.25, 32.81, 34.38, 35.16 |
| Alternative scenario | |
|---|---|
| Recommendation | BUY STOP |
| Entry Point | 32.85 |
| Take Profit | 34.38, 35.16 |
| Stop Loss | 31.70 |
| Key Levels | 28.12, 29.69, 31.25, 32.81, 34.38, 35.16 |
Current trend
Shares of Pfizer Inc., the largest American pharmaceutical company, continue to trade in a long-term downward channel.
Currently, the price has reached the lower border of the main Murrey trading range at 31.25 (Murrey level [0/8]) and may continue to decline into the reversal zone to the levels of 29.69 (Murrey level [-2/8]) and 28.12 (Murrey level [1/8], W1 chart). The key for the "bulls" is the reversal level of 32.81 (Murrey level [2/8]), supported by the central line of Bollinger Bands. Its breakout will allow the quotes to continue growing to the central mark of the Murrey trading range at 34.38 (Murrey level [4/8]) or to the level of 35.16 (Murrey level [5/8]), but this scenario seems less likely.
Technical indicators point to the continuation of the downtrend: Bollinger Bands and Stochastic are pointing downwards, while MACD is increasing in the negative zone.
Support and resistance
Resistance levels: 32.81, 34.38, 35.16.
Support levels: 31.25, 29.69, 28.12.
Trading tips
Short positions should be opened below the level of 31.25 with targets at 29.69, 28.12 and stop-loss near 32.30. Implementation period: 5-7 days.
Long positions can be opened above the 32.81 mark with targets at 34.38, 35.16 and stop-loss at 31.70.
Disclaimer: The content above represents only the views of the author or guest. It does not represent any views or positions of FOLLOWME and does not mean that FOLLOWME agrees with its statement or description, nor does it constitute any investment advice. For all actions taken by visitors based on information provided by the FOLLOWME community, the community does not assume any form of liability unless otherwise expressly promised in writing.
FOLLOWME Trading Community Website: https://www.followme.com


Hot
No comment on record. Start new comment.