NZD/USD: THE NEW ZEALAND CURRENCY REMAINS UNDER PRESSURE

| Scenario | |
|---|---|
| Timeframe | Weekly |
| Recommendation | SELL STOP |
| Entry Point | 0.5795 |
| Take Profit | 0.5737, 0.5615 |
| Stop Loss | 0.5845 |
| Key Levels | 0.5615, 0.5737, 0.5798, 0.5920, 0.6042, 0.6103 |
| Alternative scenario | |
|---|---|
| Recommendation | BUY STOP |
| Entry Point | 0.5925 |
| Take Profit | 0.6042, 0.6103 |
| Stop Loss | 0.5875 |
| Key Levels | 0.5615, 0.5737, 0.5798, 0.5920, 0.6042, 0.6103 |
Current trend
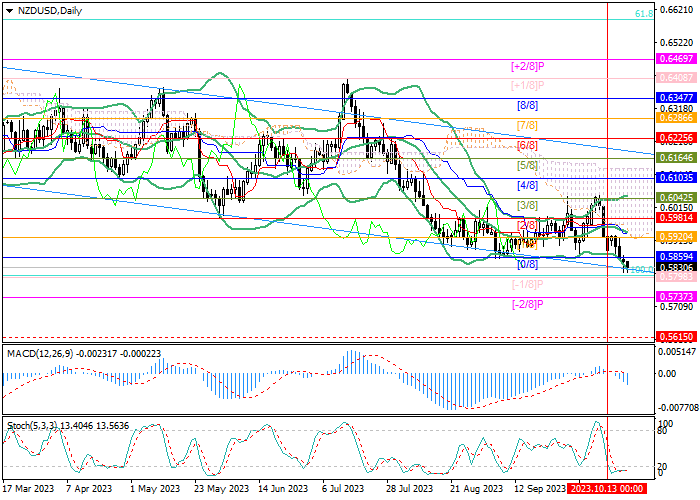
This week, the NZD/USD pair continued to decline, trading near the lower border of the downward channel at 0.5830, under pressure amid decreasing inflationary pressure in the New Zealand economy and poor macroeconomic statistics.
The Q3 consumer price index grew by 1.8% QoQ instead of the expected 2.0% and reached 5.6% YoY, significantly less than both the forecasts of 5.9% and 6.0% earlier, which will allow The Reserve Bank of New Zealand (RBNZ) leave the interest rate at 5.50%. September foreign trade data was worse than August, also hurting the national currency: exports amounted to 4.87B New Zealand dollars instead of 4.97B New Zealand dollars previously, and imports amounted to 7.20B New Zealand dollars compared to 7.24B New Zealand dollars. The trade balance remained in deficit at 2.329M New Zealand dollars.
US Federal Reserve officials, on the contrary, retain the possibility of a new increase in interest rates: the head of the regulator, Jerome Powell, who spoke in New York yesterday, was cautious and admitted that inflation in the country was still significant, and it would take several months of positive statistics to ensure its sustainable decline, while the latest data reflect continued risks of a new rise in consumer prices. Thus, employment is increasing, and consumption remains stable. Under these conditions, both tightening monetary policy and maintaining borrowing costs at the current level cannot be ruled out.
Support and resistance
The trading instrument is close to 0.5798 (Murrey level [–1/8]), consolidation below which will allow it to exit the downward channel and reach the area of 0.5737 (Murrey level [–2/8]) and 0.5615 (Murrey level [–1/8], W1). With a breakout of 0.5920 (Murrey level [1/8]), supported by the middle line of Bollinger Bands, positive dynamics will resume to 0.6042 (Murrey level [3/8]) and 0.6103 (Murrey level [4/8]).
Technical indicators confirm the likelihood of further decline: Bollinger Bands are directed downwards, the MACD histogram is increasing in the negative zone, and Stochastic is horizontal in the oversold zone.
Resistance levels: 0.5920, 0.6042, 0.6103.
Support levels: 0.5798, 0.5737, 0.5615.

Trading tips
Short positions may be opened below 0.5798 with the targets at 0.5737, 0.5615 and stop loss around 0.5845. Implementation time: 5–7 days.
Long positions may be opened above 0.5920 with the targets at 0.6042, 0.6103, and stop loss around 0.5875.
Disclaimer: The content above represents only the views of the author or guest. It does not represent any views or positions of FOLLOWME and does not mean that FOLLOWME agrees with its statement or description, nor does it constitute any investment advice. For all actions taken by visitors based on information provided by the FOLLOWME community, the community does not assume any form of liability unless otherwise expressly promised in writing.
FOLLOWME Trading Community Website: https://www.followme.com


Hot
No comment on record. Start new comment.