GBP/USD: UNCERTAINTY OF FURTHER ACTIONS OF THE US FED AND THE BOE CONSTRAINS THE MOVEMENT OF THE PAIR

![GBP/USD: UNCERTAINTY OF FURTHER ACTIONS OF THE US FED AND THE BOE CONSTRAINS THE MOVEMENT OF THE PAIR]()
Scenario Timeframe Weekly Recommendation SELL STOP Entry Point 1.2080 Take Profit 1.1962, 1.1800 Stop Loss 1.2155 Key Levels 1.1800, 1.1962, 1.2085, 1.2207, 1.2329, 1.2490, 1.2695
Alternative scenario Recommendation BUY STOP Entry Point 1.2330 Take Profit 1.2490, 1.2695 Stop Loss 1.2250 Key Levels 1.1800, 1.1962, 1.2085, 1.2207, 1.2329, 1.2490, 1.2695
Current trend
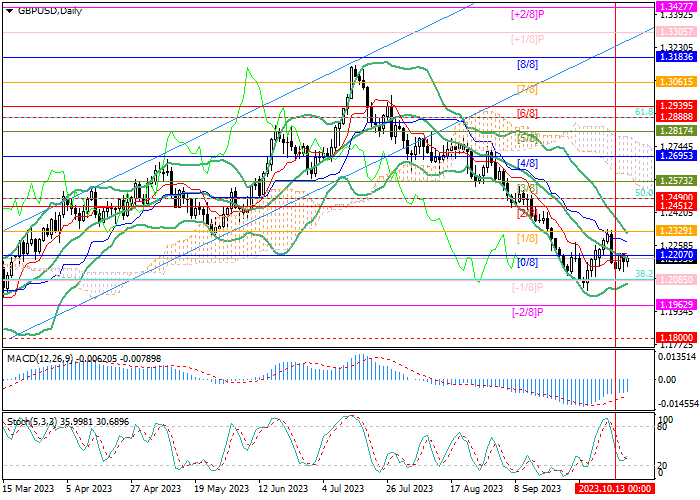
The GBP/USD pair rose to the level of 1.2207 (Murrey level [0/8]), waiting for new drivers of movement.
Currently, there is uncertainty in the market amid published macroeconomic data. September statistics on the dynamics of retail sales in the United States recorded an increase of 0.7%, which turned out to be significantly higher than forecasts. Under these conditions, the probability of an adjustment in the cost of borrowing by the US regulator increases, as the economy demonstrates resistance to the current measures of the US Federal Reserve and retains the risks of renewed strengthening of inflationary pressure.
In the UK, September data on the consumer price index were presented today: the indicator rose from 0.3% to 0.5% MoM and remained at 6.7% YoY with a forecast of 6.6%. A slowdown in the rate of decline in inflation may lead to a resumption of tightening of monetary conditions by the Bank of England. Thus, both regulators can break the pause and return to an increase in the cost of borrowing, which is why investors are taking a wait-and-see position.
Support and resistance
The price is testing the 1.2207 mark (Murrey level [0/8], the central line of Bollinger Bands), but to change the current downtrend, a breakout above 1.2329 (Murrey level [1/8], the upper line of Bollinger Bands) is needed. In this case, growth will continue to the levels of 1.2490 (50.0% Fibo retracement) and 1.2695 (Murrey level [4/8]). The key for the "bears" is the 1.2085 mark (Murrey level [-1/8], 38.2% Fibo retracement), consolidation below which will allow quotes to decline to 1.1962 (Murrey level [-2/8]) and 1.1800.
Technical indicators do not give a clear signal: Bollinger Bands are pointing down, MACD is stable in the negative zone, and Stochastic is reversing up.
Resistance levels: 1.2207, 1.2329, 1.2490, 1.2695.
Support levels: 1.2085, 1.1962, 1.1800.
Trading tips
Short positions can be opened below the level of 1.2085 with targets at 1.1962, 1.1800 and stop-loss at 1.2155. Implementation period: 5-7 days.
Long positions can be opened above the level of 1.2329 with targets at 1.2490, 1.2695 and stop-loss at 1.2250.
| Scenario | |
|---|---|
| Timeframe | Weekly |
| Recommendation | SELL STOP |
| Entry Point | 1.2080 |
| Take Profit | 1.1962, 1.1800 |
| Stop Loss | 1.2155 |
| Key Levels | 1.1800, 1.1962, 1.2085, 1.2207, 1.2329, 1.2490, 1.2695 |
| Alternative scenario | |
|---|---|
| Recommendation | BUY STOP |
| Entry Point | 1.2330 |
| Take Profit | 1.2490, 1.2695 |
| Stop Loss | 1.2250 |
| Key Levels | 1.1800, 1.1962, 1.2085, 1.2207, 1.2329, 1.2490, 1.2695 |
Current trend
The GBP/USD pair rose to the level of 1.2207 (Murrey level [0/8]), waiting for new drivers of movement.
Currently, there is uncertainty in the market amid published macroeconomic data. September statistics on the dynamics of retail sales in the United States recorded an increase of 0.7%, which turned out to be significantly higher than forecasts. Under these conditions, the probability of an adjustment in the cost of borrowing by the US regulator increases, as the economy demonstrates resistance to the current measures of the US Federal Reserve and retains the risks of renewed strengthening of inflationary pressure.
In the UK, September data on the consumer price index were presented today: the indicator rose from 0.3% to 0.5% MoM and remained at 6.7% YoY with a forecast of 6.6%. A slowdown in the rate of decline in inflation may lead to a resumption of tightening of monetary conditions by the Bank of England. Thus, both regulators can break the pause and return to an increase in the cost of borrowing, which is why investors are taking a wait-and-see position.
Support and resistance
The price is testing the 1.2207 mark (Murrey level [0/8], the central line of Bollinger Bands), but to change the current downtrend, a breakout above 1.2329 (Murrey level [1/8], the upper line of Bollinger Bands) is needed. In this case, growth will continue to the levels of 1.2490 (50.0% Fibo retracement) and 1.2695 (Murrey level [4/8]). The key for the "bears" is the 1.2085 mark (Murrey level [-1/8], 38.2% Fibo retracement), consolidation below which will allow quotes to decline to 1.1962 (Murrey level [-2/8]) and 1.1800.
Technical indicators do not give a clear signal: Bollinger Bands are pointing down, MACD is stable in the negative zone, and Stochastic is reversing up.
Resistance levels: 1.2207, 1.2329, 1.2490, 1.2695.
Support levels: 1.2085, 1.1962, 1.1800.
Trading tips
Short positions can be opened below the level of 1.2085 with targets at 1.1962, 1.1800 and stop-loss at 1.2155. Implementation period: 5-7 days.
Long positions can be opened above the level of 1.2329 with targets at 1.2490, 1.2695 and stop-loss at 1.2250.
Disclaimer: The content above represents only the views of the author or guest. It does not represent any views or positions of FOLLOWME and does not mean that FOLLOWME agrees with its statement or description, nor does it constitute any investment advice. For all actions taken by visitors based on information provided by the FOLLOWME community, the community does not assume any form of liability unless otherwise expressly promised in writing.
FOLLOWME Trading Community Website: https://www.followme.com


Hot
No comment on record. Start new comment.