DAX 40: QUARTERLY REVIEW


We present a medium-term investment overview of the Frankfurt Stock Exchange DAX 40 Index.
Since the beginning of autumn, the dynamics of world indicators have been neutral or close to downward but the indicator of leading German enterprises is experiencing the greatest pressure. Thus, at the beginning of the week, the International Monetary Fund (IMF) presented a renewed forecast for the global economy for 2023: according to new estimates, its growth will remain at 3.0% due to an improvement in the situation in the G7 countries but among them, Germany’s gross domestic product (GDP) may show negative dynamics, contracting by 0.5%. The forecast has been revised downward four times this year, and past estimates made at the end of summer suggested a decline of 0.3%. The reason for the weakness of the German economy is the country’s refusal to purchase natural gas and oil from Russia, which provided almost all the needs of the national industry. The September consumer price index fell from 6.4% to 4.3%, not enough for the European Central Bank (ECB) to begin easing monetary policy, and as long as interest rates remain at current levels, the pressure on the economy will not ease.
In addition, the debt market remains in a stable upward trend, attracting more and more investment capital: thus since the beginning of autumn, the yield on Germany’s leading 10-year bonds has increased from 2.543% to 2.893%, which puts pressure on the stock index. The most conservative 30-year note is trading at 3.061%, up from 2.564% in early fall.
In addition to the underlying fundamental factors, technical indicators are signaling a possible decline soon: on the weekly chart, the price is correcting to global growth, holding below the initial 23.6% Fibonacci correction level at 15400.0.
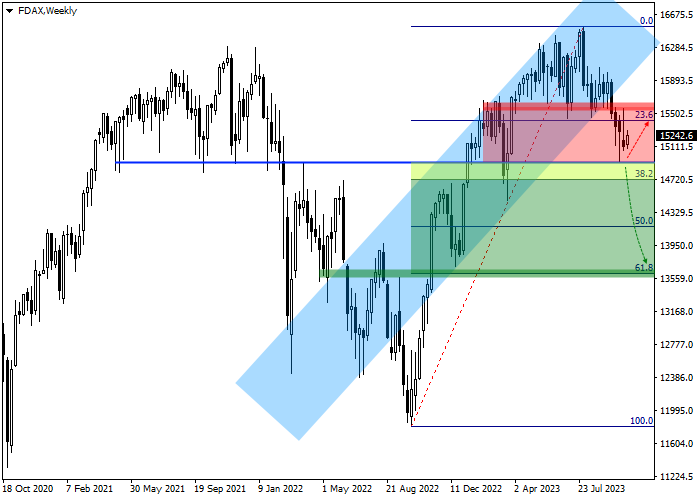
The main factors indicate a high probability of continued decline and the price reaching the 38.2% basic Fibonacci correction at 14720.0, consolidation below which will be the main driver for a further decline in the quotes. Key levels can be viewed on the daily chart.
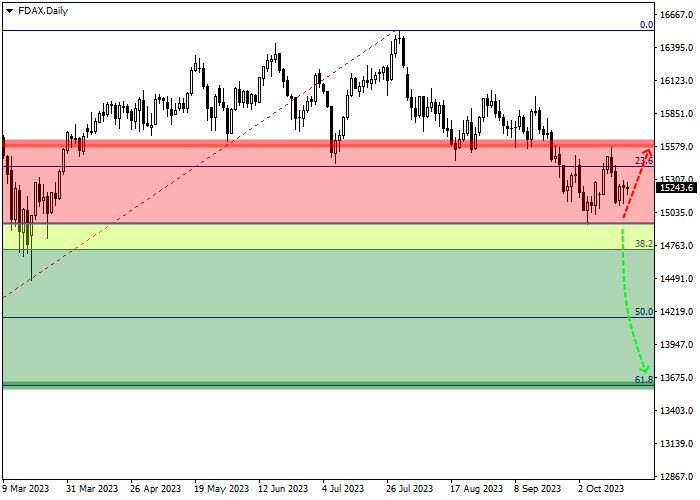
As can be seen on the chart, at the beginning of the month, a local low formed at 14930.0, from which the potential for decline will increase significantly. If the price overcomes the high of the current trend of 15600.0, the downward scenario will either be canceled or noticeably delayed in time, and it is better to liquidate open sell positions. The target zone is at 61.8% Fibonacci full correction level of 13600.0, if reached, it is better to close profitable sell positions.
The entry levels can be assessed in more detail on the four-hour chart.
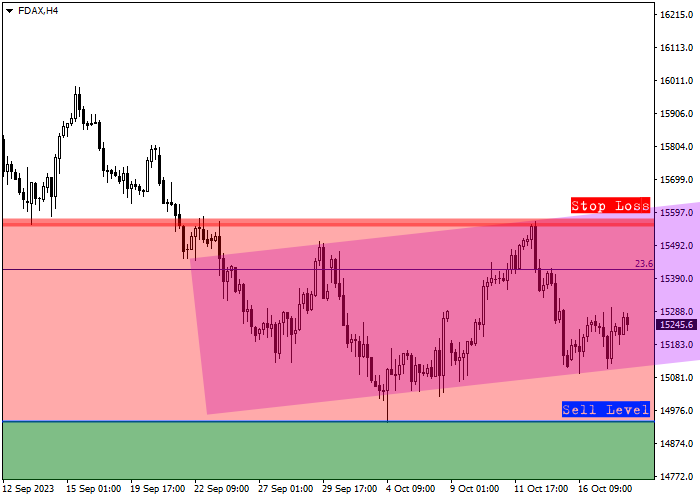
The entry levels for short positions are located at 14900.0, and a local signal can be received in the coming days, when the minimum of October 4 is broken through, after which there will be no significant support left on the price path to the target level of 13600.0.
Considering the average daily volatility of a trading instrument over the last month, which is 1123.0 points, the price movement to the target zone of 13600.0 may take approximately 45 trading sessions but if the indicator increases, this time may be reduced to 37 days.
We present a medium-term investment overview of the Frankfurt Stock Exchange DAX 40 Index.
Since the beginning of autumn, the dynamics of world indicators have been neutral or close to downward but the indicator of leading German enterprises is experiencing the greatest pressure. Thus, at the beginning of the week, the International Monetary Fund (IMF) presented a renewed forecast for the global economy for 2023: according to new estimates, its growth will remain at 3.0% due to an improvement in the situation in the G7 countries but among them, Germany’s gross domestic product (GDP) may show negative dynamics, contracting by 0.5%. The forecast has been revised downward four times this year, and past estimates made at the end of summer suggested a decline of 0.3%. The reason for the weakness of the German economy is the country’s refusal to purchase natural gas and oil from Russia, which provided almost all the needs of the national industry. The September consumer price index fell from 6.4% to 4.3%, not enough for the European Central Bank (ECB) to begin easing monetary policy, and as long as interest rates remain at current levels, the pressure on the economy will not ease.
In addition, the debt market remains in a stable upward trend, attracting more and more investment capital: thus since the beginning of autumn, the yield on Germany’s leading 10-year bonds has increased from 2.543% to 2.893%, which puts pressure on the stock index. The most conservative 30-year note is trading at 3.061%, up from 2.564% in early fall.
In addition to the underlying fundamental factors, technical indicators are signaling a possible decline soon: on the weekly chart, the price is correcting to global growth, holding below the initial 23.6% Fibonacci correction level at 15400.0.
The main factors indicate a high probability of continued decline and the price reaching the 38.2% basic Fibonacci correction at 14720.0, consolidation below which will be the main driver for a further decline in the quotes. Key levels can be viewed on the daily chart.
As can be seen on the chart, at the beginning of the month, a local low formed at 14930.0, from which the potential for decline will increase significantly. If the price overcomes the high of the current trend of 15600.0, the downward scenario will either be canceled or noticeably delayed in time, and it is better to liquidate open sell positions. The target zone is at 61.8% Fibonacci full correction level of 13600.0, if reached, it is better to close profitable sell positions.
The entry levels can be assessed in more detail on the four-hour chart.
The entry levels for short positions are located at 14900.0, and a local signal can be received in the coming days, when the minimum of October 4 is broken through, after which there will be no significant support left on the price path to the target level of 13600.0.
Considering the average daily volatility of a trading instrument over the last month, which is 1123.0 points, the price movement to the target zone of 13600.0 may take approximately 45 trading sessions but if the indicator increases, this time may be reduced to 37 days.
Disclaimer: The content above represents only the views of the author or guest. It does not represent any views or positions of FOLLOWME and does not mean that FOLLOWME agrees with its statement or description, nor does it constitute any investment advice. For all actions taken by visitors based on information provided by the FOLLOWME community, the community does not assume any form of liability unless otherwise expressly promised in writing.
FOLLOWME Trading Community Website: https://www.followme.com


Hot
No comment on record. Start new comment.