USD/CHF: AMERICAN DOLLAR DECLINES IN ANTICIPATION OF THE SPEECH OF THE CHAIRMAN OF THE US FEDERAL RESERVE


Scenario Timeframe Intraday Recommendation SELL STOP Entry Point 0.8975 Take Profit 0.8930 Stop Loss 0.9000 Key Levels 0.8900, 0.8930, 0.8950, 0.8976, 0.9000, 0.9025, 0.9050, 0.9072
Alternative scenario Recommendation BUY STOP Entry Point 0.9005 Take Profit 0.9050 Stop Loss 0.8976 Key Levels 0.8900, 0.8930, 0.8950, 0.8976, 0.9000, 0.9025, 0.9050, 0.9072
Current trend
The USD/CHF pair is showing a slight decline, trying to consolidate below the psychological level of 0.9000. Market activity remains subdued as traders await today's release of the Beige Book, a monthly economic review from the US Federal Reserve. Also, during the day, there will be several speeches by representatives of the regulator, who can express their assessments regarding the prospects for further tightening of its monetary policy.
In addition, today the focus of investors' attention will be the September statistics on dynamics in the American real estate market. Analysts expect Housing Starts to rise from 1.283 million to 1.380 million, while Building Permits could fall from 1.543 million to 1.450 million.
Tomorrow, trading participants will focus on September data on the dynamics of Imports and Exports in Switzerland. Forecasts suggest a decrease in the trade surplus from 4.05 billion francs to 3.77 billion francs, while over the past period, Exports rose from 20.73 billion francs to 21.16 billion francs, and Imports fell from 17.60 billion francs to 17.11 billion francs.
Support and resistance
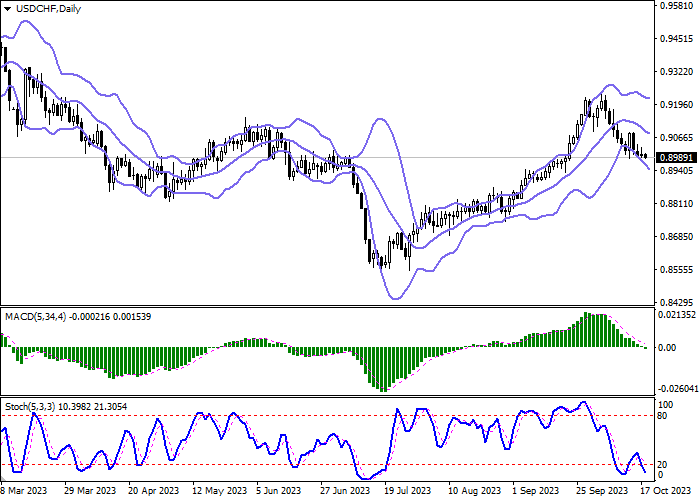
On the D1 chart Bollinger Bands are reversing into the descending plane. The price range expands from below, making way for new local lows for the "bears". MACD is going down preserving a stable sell signal (located below the signal line). The indicator is trying to consolidate below the zero level. Stochastic also maintains a strong downward direction, but is located near its lows, signaling the risks of oversold US dollar in the ultra-short term.
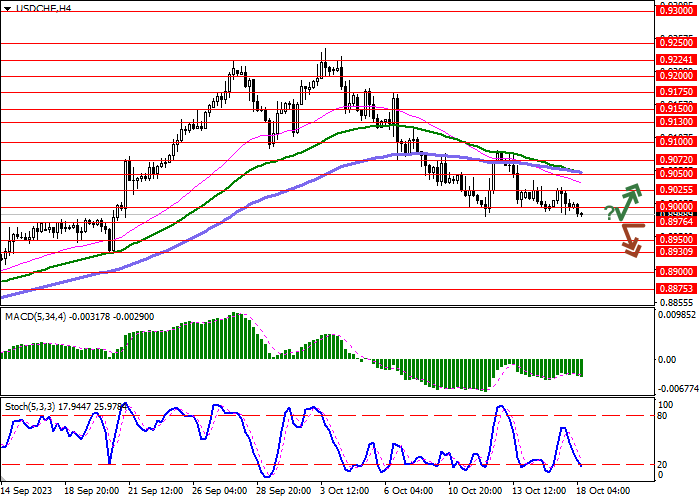
Resistance levels: 0.9000, 0.9025, 0.9050, 0.9072.
Support levels: 0.8976, 0.8950, 0.8930, 0.8900.
Trading tips
Short positions may be opened after a breakdown of 0.8976 with the target at 0.8930. Stop-loss — 0.9000. Implementation time: 1-2 days.
A rebound from 0.8976 as from support followed by a breakout of 0.9000 may become a signal for opening new long positions with the target at 0.9050. Stop-loss — 0.8976.
| Scenario | |
|---|---|
| Timeframe | Intraday |
| Recommendation | SELL STOP |
| Entry Point | 0.8975 |
| Take Profit | 0.8930 |
| Stop Loss | 0.9000 |
| Key Levels | 0.8900, 0.8930, 0.8950, 0.8976, 0.9000, 0.9025, 0.9050, 0.9072 |
| Alternative scenario | |
|---|---|
| Recommendation | BUY STOP |
| Entry Point | 0.9005 |
| Take Profit | 0.9050 |
| Stop Loss | 0.8976 |
| Key Levels | 0.8900, 0.8930, 0.8950, 0.8976, 0.9000, 0.9025, 0.9050, 0.9072 |
Current trend
The USD/CHF pair is showing a slight decline, trying to consolidate below the psychological level of 0.9000. Market activity remains subdued as traders await today's release of the Beige Book, a monthly economic review from the US Federal Reserve. Also, during the day, there will be several speeches by representatives of the regulator, who can express their assessments regarding the prospects for further tightening of its monetary policy.
In addition, today the focus of investors' attention will be the September statistics on dynamics in the American real estate market. Analysts expect Housing Starts to rise from 1.283 million to 1.380 million, while Building Permits could fall from 1.543 million to 1.450 million.
Tomorrow, trading participants will focus on September data on the dynamics of Imports and Exports in Switzerland. Forecasts suggest a decrease in the trade surplus from 4.05 billion francs to 3.77 billion francs, while over the past period, Exports rose from 20.73 billion francs to 21.16 billion francs, and Imports fell from 17.60 billion francs to 17.11 billion francs.
Support and resistance
On the D1 chart Bollinger Bands are reversing into the descending plane. The price range expands from below, making way for new local lows for the "bears". MACD is going down preserving a stable sell signal (located below the signal line). The indicator is trying to consolidate below the zero level. Stochastic also maintains a strong downward direction, but is located near its lows, signaling the risks of oversold US dollar in the ultra-short term.
Resistance levels: 0.9000, 0.9025, 0.9050, 0.9072.
Support levels: 0.8976, 0.8950, 0.8930, 0.8900.
Trading tips
Short positions may be opened after a breakdown of 0.8976 with the target at 0.8930. Stop-loss — 0.9000. Implementation time: 1-2 days.
A rebound from 0.8976 as from support followed by a breakout of 0.9000 may become a signal for opening new long positions with the target at 0.9050. Stop-loss — 0.8976.
Disclaimer: The content above represents only the views of the author or guest. It does not represent any views or positions of FOLLOWME and does not mean that FOLLOWME agrees with its statement or description, nor does it constitute any investment advice. For all actions taken by visitors based on information provided by the FOLLOWME community, the community does not assume any form of liability unless otherwise expressly promised in writing.
FOLLOWME Trading Community Website: https://www.followme.com


Hot
No comment on record. Start new comment.