EUR/USD: THE INSTRUMENT IS CONSOLIDATING IN ANTICIPATION OF NEW DRIVERS


| Scenario | |
|---|---|
| Timeframe | Intraday |
| Recommendation | BUY STOP |
| Entry Point | 1.0565 |
| Take Profit | 1.0630 |
| Stop Loss | 1.0520 |
| Key Levels | 1.0350, 1.0400, 1.0450, 1.0500, 1.0561, 1.0600, 1.0630, 1.0660 |
| Alternative scenario | |
|---|---|
| Recommendation | SELL STOP |
| Entry Point | 1.0495 |
| Take Profit | 1.0400 |
| Stop Loss | 1.0550 |
| Key Levels | 1.0350, 1.0400, 1.0450, 1.0500, 1.0561, 1.0600, 1.0630, 1.0660 |
Current trend
The EUR/USD pair shows a slight decline, correcting after a rise the day before. The instrument is testing 1.0550 for a breakdown; however, activity on the market remains quite low as investors await the publication of new drivers.
Today the focus will be on business sentiment statistics from the Center for European Economic Research (ZEW). The eurozone's Economic Sentiment Index is projected to rise from -8.9 points to -8.0 points in October, while the German Economic Sentiment Index is forecast to rise from -11.4 points to -9.0 points, while the Current Situation Index may decrease from -79.4 points to -80.5 points.
In the US, September data on Retail Sales and Industrial Production will be presented during the day. Analysts expect a slowdown in sales dynamics from 0.6% to 0.3%, along with the figure excluding autos (from 0.6% to 0.2%), as well as a reduction in Industrial Production from 0.4% to 0.0%.
In addition, this week investors will evaluate inflation statistics in the eurozone. In September, the Consumer Price Index is expected to remain unchanged at 0.3% on a monthly basis and 4.3% on an annual basis.
Support and resistance
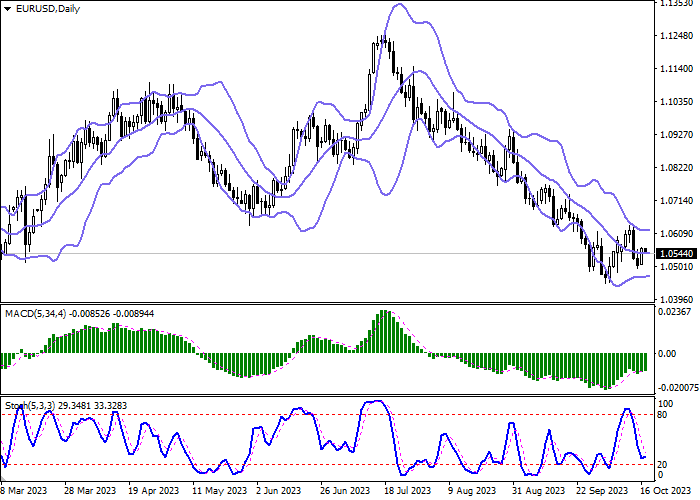
In the D1 chart, Bollinger Bands are reversing horizontally. The price range is slightly narrowed from below, remaining spacious enough for the current market activity. MACD is growing preserving a weak buy signal (located above the signal line). Stochastic, approaching the level of "20", reversed horizontally, signaling the risks of the single currency being oversold in the ultra-short term.
Resistance levels: 1.0561, 1.0600, 1.0630, 1.0660.
Support levels: 1.0500, 1.0450, 1.0400, 1.0350.
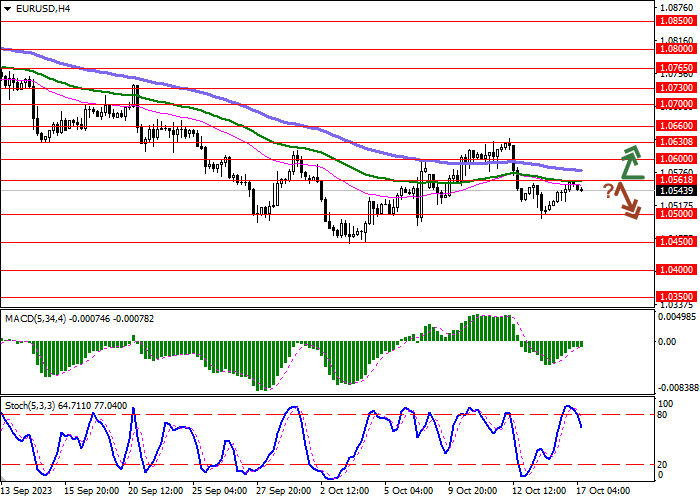
Trading tips
Long positions can be opened after a breakout of 1.0561 with the target of 1.0630. Stop-loss — 1.0520. Implementation time: 1-2 days.
A rebound from 1.0561 as from resistance, followed by a breakdown of 1.0500 may become a signal for opening of new short positions with the target at 1.0400. Stop-loss — 1.0550.
Disclaimer: The content above represents only the views of the author or guest. It does not represent any views or positions of FOLLOWME and does not mean that FOLLOWME agrees with its statement or description, nor does it constitute any investment advice. For all actions taken by visitors based on information provided by the FOLLOWME community, the community does not assume any form of liability unless otherwise expressly promised in writing.
FOLLOWME Trading Community Website: https://www.followme.com


Hot
No comment on record. Start new comment.