GENERAL ELECTRIC CO.: TECHNICAL ANALYSIS

| Scenario | |
|---|---|
| Timeframe | Weekly |
| Recommendation | SELL STOP |
| Entry Point | 106.75 |
| Take Profit | 100.60 |
| Stop Loss | 110.00 |
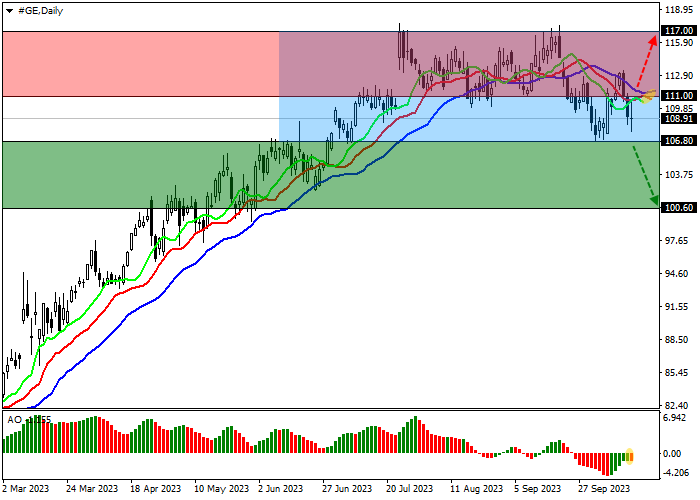
| Key Levels | 100.60, 106.80, 111.00, 117.00 |
| Alternative scenario | |
|---|---|
| Recommendation | BUY STOP |
| Entry Point | 111.05 |
| Take Profit | 117.00 |
| Stop Loss | 108.00 |
| Key Levels | 100.60, 106.80, 111.00, 117.00 |
Shares of General Electric Co., an American diversified corporation, are moving as part of an intensifying correction at 109.00.
On the daily chart, the price returned to the sideways range with boundaries of 117.00–107.00, preparing to exit it downwards.
On the four-hour chart, it is clear that the decline may continue since quotes are close to the minimum of September 5, 107.00, after overcoming which there will be almost no significant support on the way to 100.00.
Technical indicators maintain a stable sell signal: fast EMA on the Alligator indicator are below the signal line, keeping the fluctuation range wide, and the AO histogram forms corrective bars in the sell zone.

Trading tips
Short positions may be opened after a reversal, decline, and consolidation of the price below 106.80 with the target at 100.60. Stop loss – 110.00. Implementation period: 7 days or more.
Long positions may be opened after a reversal, growth, and consolidation of the price above 111.00 with the target at 117.00. Stop loss – 108.00.
Disclaimer: The content above represents only the views of the author or guest. It does not represent any views or positions of FOLLOWME and does not mean that FOLLOWME agrees with its statement or description, nor does it constitute any investment advice. For all actions taken by visitors based on information provided by the FOLLOWME community, the community does not assume any form of liability unless otherwise expressly promised in writing.
FOLLOWME Trading Community Website: https://www.followme.com


Hot
No comment on record. Start new comment.