USD/CHF: FIBONACCI ANALYSIS


| Scenario | |
|---|---|
| Timeframe | Weekly |
| Recommendation | SELL STOP |
| Entry Point | 0.8965 |
| Take Profit | 0.8895, 0.8815 |
| Stop Loss | 0.9020 |
| Key Levels | 0.8815, 0.8895, 0.8970, 0.9095, 0.9210, 0.9340 |
| Alternative scenario | |
|---|---|
| Recommendation | BUY STOP |
| Entry Point | 0.9100 |
| Take Profit | 0.9210, 0.9340 |
| Stop Loss | 0.9010 |
| Key Levels | 0.8815, 0.8895, 0.8970, 0.9095, 0.9210, 0.9340 |
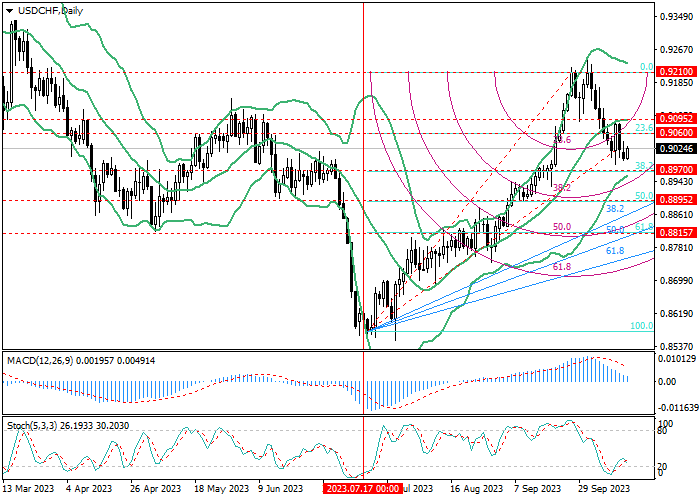
USD/CHF, D1
On the daily chart, the USD/CHF pair is moving downwards, reversing at 0.9210 (0.0% correction): currently, the price is close to 0.8970 (38.2% correction), the breakdown of which will allow it to reach the 0.8895 area (50.0 correction %) and 0.8815 (61.8% correction), for which it will be necessary to overcome the ascending fan. If quotes re-consolidate above 0.9060 (23.6% correction) and the middle line of Bollinger Bands (0.9095), they will be able to return to the area of 0.9210.
Technical indicators do not give a single signal: Bollinger Bands are directed upward, the MACD histogram is increasing in the positive zone, and Stochastic is reversing downwards.
USD/CHF, W1
On the weekly chart, the USD/CHF pair reversed downwards from 0.9165 (38.2% correction) and may continue its downward trend to the area of 0.8955 (23.6% correction) and 0.8895 (middle line of Bollinger Bands). The key “bullish” level is 0.9165, and consolidation above it again will allow the quotes to rise to 0.9340 (50.0% correction).
Technical indicators do not give a single signal: Bollinger bands reverse horizontally after a decline, and the MACD histogram is preparing to move into the positive zone but Stochastic reversed downwards.

Support and resistance
Continuation of the negative dynamics seems more likely: if the consolidation below 0.8970 (correction 38.2%, D1), it will continue to the area of 0.8895 (correction 50.0%, D1, the middle line of Bollinger bands, W1) and 0.8815 (correction 61.8 %, D1), however, in the event of a breakout of 0.9095 (the middle line of Bollinger bands, D1), growth can resume to 0.9210 (0.0% correction, D1) and 0.9340 (50.0% correction, W1).
Resistance levels: 0.9095, 0.9210, 0.9340.
Support levels: 0.8970, 0.8895, 0.8815.
Trading tips
Short positions may be opened below 0.8970 with the targets at 0.8895, 0.8815 and stop loss around 0.9020. Implementation time: 5–7 days.
Long positions may be opened above 0.9095 with the targets at 0.9210, 0.9340 and stop loss around 0.9010.
Disclaimer: The content above represents only the views of the author or guest. It does not represent any views or positions of FOLLOWME and does not mean that FOLLOWME agrees with its statement or description, nor does it constitute any investment advice. For all actions taken by visitors based on information provided by the FOLLOWME community, the community does not assume any form of liability unless otherwise expressly promised in writing.
FOLLOWME Trading Community Website: https://www.followme.com


Hot
No comment on record. Start new comment.