XAU/USD: GOLD PRICES ARE CORRECTING AFTER STRONG GROWTH LAST WEEK


| Scenario | |
|---|---|
| Timeframe | Intraday |
| Recommendation | SELL STOP |
| Entry Point | 1914.95 |
| Take Profit | 1900.00 |
| Stop Loss | 1923.06 |
| Key Levels | 1892.75, 1900.00, 1907.40, 1915.00, 1923.06, 1930.00, 1940.00, 1946.78 |
| Alternative scenario | |
|---|---|
| Recommendation | BUY STOP |
| Entry Point | 1923.10 |
| Take Profit | 1940.00 |
| Stop Loss | 1915.00 |
| Key Levels | 1892.75, 1900.00, 1907.40, 1915.00, 1923.06, 1930.00, 1940.00, 1946.78 |
Current trend
The XAU/USD pair is declining, correcting after a sharp rise last Friday, as a result of which local highs from September 20 were updated. The instrument is testing 1920.00, waiting for new drivers to appear on the market.
Quotes are supported by rising tensions in the Middle East as the Palestinian-Israeli conflict worsens. In addition, investors are weighing the prospects for further increases in borrowing costs by global central banks, suggesting that the US Federal Reserve has already peaked in the current hike cycle, although analysts allow for a 35.0% chance of another 25-basis-point rate adjustment in November.
Macroeconomic statistics published last week may contribute to the resumption of tightening of monetary policy by the American regulator this year. The Consumer Price Index in September added 0.4% in monthly terms and 3.7% in annual terms, while experts expected growth of 0.3% and 3.6%, respectively. Pressure on the position of the US dollar last Friday was also exerted by data on the Consumer Confidence index from the University of Michigan: in October, the indicator dropped from 68.1 points to 63.0 points, while the forecast was 67.4 points.
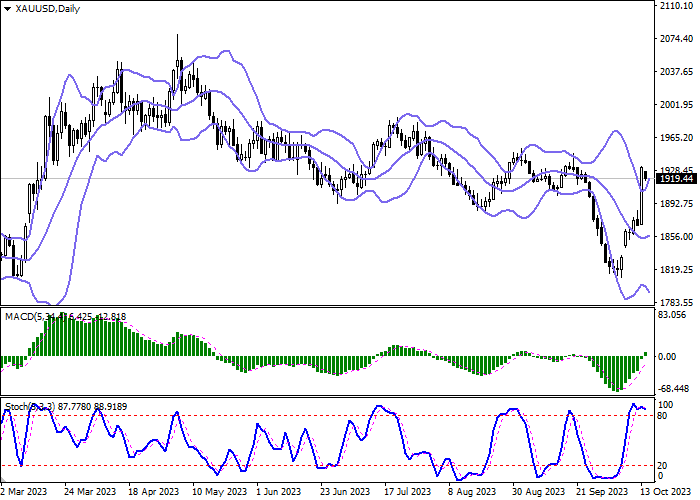
Support and resistance
On the D1 chart Bollinger Bands are trying to reverse into the ascending plane. The price range is expanding but it fails to conform to the surge of "bullish" sentiments at the moment. MACD grows, preserving a stable buy signal (located above the signal line). The indicator is also trying to consolidate above the zero level. Stochastic, having reached its highs, reverses downwards, forming a new sell signal.
Resistance levels: 1923.06, 1930.00, 1940.00, 1946.78.
Support levels: 1915.00, 1907.40, 1900.00, 1892.75.
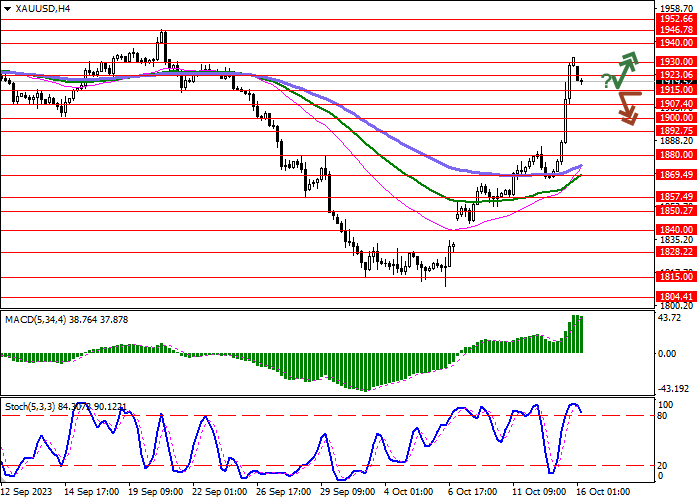
Trading tips
Short positions may be opened after a breakdown of 1915.00 with the target at 1900.00. Stop-loss — 1923.06. Implementation time: 1-2 days.
A rebound from 1915.00 as from support followed by a breakout of 1923.06 may become a signal for opening new long positions with the target at 1940.00. Stop-loss — 1915.00.
Disclaimer: The content above represents only the views of the author or guest. It does not represent any views or positions of FOLLOWME and does not mean that FOLLOWME agrees with its statement or description, nor does it constitute any investment advice. For all actions taken by visitors based on information provided by the FOLLOWME community, the community does not assume any form of liability unless otherwise expressly promised in writing.
FOLLOWME Trading Community Website: https://www.followme.com


Hot
No comment on record. Start new comment.